Likert Scale Examples + Free Generator

The difference between generic data and actionable intelligence often comes down to how you ask the question. We've updated our 2026 collection of 8 Likert scale examples with questions designed to help you act faster on guest sentiment
As a busy hospitality or service owner, you know customer feedback is the lifeblood of your business. But asking a generic "How did we do?" only scratches the surface, leaving you with vague, unhelpful answers that are impossible to act on. To get ahead, you need to collect smarter feedback. The secret to unlocking truly valuable insights lies not just in what you ask, but how you ask it. It’s about moving from simple satisfaction checks to a nuanced understanding of the customer experience, a crucial element for complex initiatives like B2B customer journey mapping where every touchpoint matters.
Looking to generate scientifically validated 5-point and 7-point Likert scales for your industry? Launch the Likert Architect.
This is where the Likert scale becomes your most powerful tool. By using a structured scale of responses, you can measure attitudes, opinions, and perceptions with precision. This guide is built for action. We're not just giving you a list; we’re providing a strategic toolkit of 8 powerful, ready-to-copy likert scale examples specifically tailored for hospitality, restaurants, retail, healthcare, entertainment and professional services.
We’ll break down which scale to use and when, how to word your questions for maximum clarity, and how to analyze the results to collect smarter, act faster, and grow stronger. For example, by connecting targeted survey responses to a guest's stay through an integration with your PMS like Mews, you can trigger automated service recovery workflows. Our Resolutions Engine—built for automated service recovery—can turn a negative experience into a loyal customer before a bad review ever goes public. It's time to transform your feedback process from a simple check-in to a strategic growth engine.
1. 5-Point Satisfaction Scale
The 5-point satisfaction scale is the quintessential Likert scale example, serving as the industry-standard framework for measuring sentiment. It provides a balanced spectrum of choices, typically ranging from "Very Dissatisfied" to "Very Satisfied," with a neutral midpoint. This structure is intuitive for customers and offers enough detail for meaningful analysis without causing survey fatigue.

Its power lies in its versatility and simplicity, making it a go-to for everything from hotel checkout surveys to post-appointment healthcare feedback. The resulting data is easy to quantify, allowing you to calculate a Customer Satisfaction (CSAT) score by averaging responses or focusing on the percentage of satisfied customers.
Strategic Analysis & Application
The primary advantage of the 5-point scale is its balance. It captures a degree of nuance that a simple "yes/no" question cannot, while avoiding the complexity of a 7 or 10-point scale. This clarity is crucial for quick, actionable feedback.
Key Tactic: Use the neutral "Neither Satisfied nor Dissatisfied" option as a trigger point. A high volume of neutral responses can signal indifference or an experience that was simply forgettable, which is a risk in a competitive market. It’s an opportunity to investigate why your service isn’t creating a strong positive impression.
How to Implement This Scale
This is the workhorse of your feedback strategy. Use it to get a quick pulse on key touchpoints.
Hospitality: "How satisfied were you with the check-in process?" (Very Dissatisfied to Very Satisfied)
Restaurants: "Please rate your satisfaction with the quality of your meal." (Very Unsatisfied to Very Satisfied)
Healthcare: "How satisfied are you with the clarity of the information provided by your doctor?" (Extremely Dissatisfied to Extremely Satisfied)
Actionable Takeaways
Once you collect this data, you must act faster. Use FeedbackRobot's AI Summaries for instant insights & sentiment analysis, which analyze thousands of responses to identify key trends and sentiment drivers without manual work. If a guest rates their stay a 2 out of 5, our Resolutions Engine—the automated service recovery tool—can automatically trigger a follow-up apology and an offer to make it right, turning a negative experience into a loyal customer.
Looking for templates? Download our free Sample Customer Feedback Form Template to start today.
2. 7-Point Agreement Scale
The 7-point agreement scale expands on the classic 5-point model, offering a more granular spectrum for measuring attitudes and perceptions. It ranges from "Strongly Disagree" to "Strongly Agree," providing two additional levels of nuance on each side of the neutral midpoint. This increased fidelity is ideal for complex assessments where subtle differences in opinion are critical to understanding the customer experience.

Its strength lies in capturing finer degrees of sentiment, making it a favorite in academic research and professional service contexts. For your business, it allows for a more precise evaluation of service quality, staff performance, or brand perception, where a simple "satisfied" or "dissatisfied" might not tell the whole story.
Strategic Analysis & Application
The primary advantage of the 7-point scale is its heightened sensitivity. It can detect minor shifts in respondent attitudes that a 5-point scale might miss, which is crucial for high-touch service industries. By providing options like "Slightly Agree" or "Slightly Disagree," you empower customers to express their feelings more accurately, reducing the chance they default to a neutral answer.
Key Tactic: Analyze the distribution of responses between "Slightly Agree" (5) and "Agree" (6). A high concentration in the "Slightly Agree" category can indicate that your service meets expectations but doesn't exceed them. This is a critical insight, highlighting an opportunity to elevate the experience from acceptable to exceptional.
How to Implement This Scale
This scale is most effective when assessing specific attributes of an experience. Remember to keep the survey focused; using a 7-point scale for more than five or six questions can lead to respondent fatigue.
Professional Services: "The advice our consultant provided was strategic and valuable." (Strongly Disagree to Strongly Agree)
Retail: "The sales associate was both friendly and helpful during my visit." (Strongly Disagree to Strongly Agree)
Restaurants: "The restaurant’s ambiance contributed positively to my dining experience." (Strongly Disagree to Strongly Agree)
Actionable Takeaways
Drilling down into this nuanced data is key to growing stronger. FeedbackRobot’s AI Summaries provide instant insights & sentiment analysis to process thousands of these detailed responses, pinpointing precisely why customers "Slightly Disagree" with a statement and revealing specific friction points you might otherwise miss. If a pattern of low agreement scores emerges for a specific location or team member, our Radar dashboard—your unified review intelligence hub—will flag it, allowing you to intervene with targeted training or operational adjustments before minor issues become major problems.
3. 10-Point Net Promoter Score (NPS) Scale
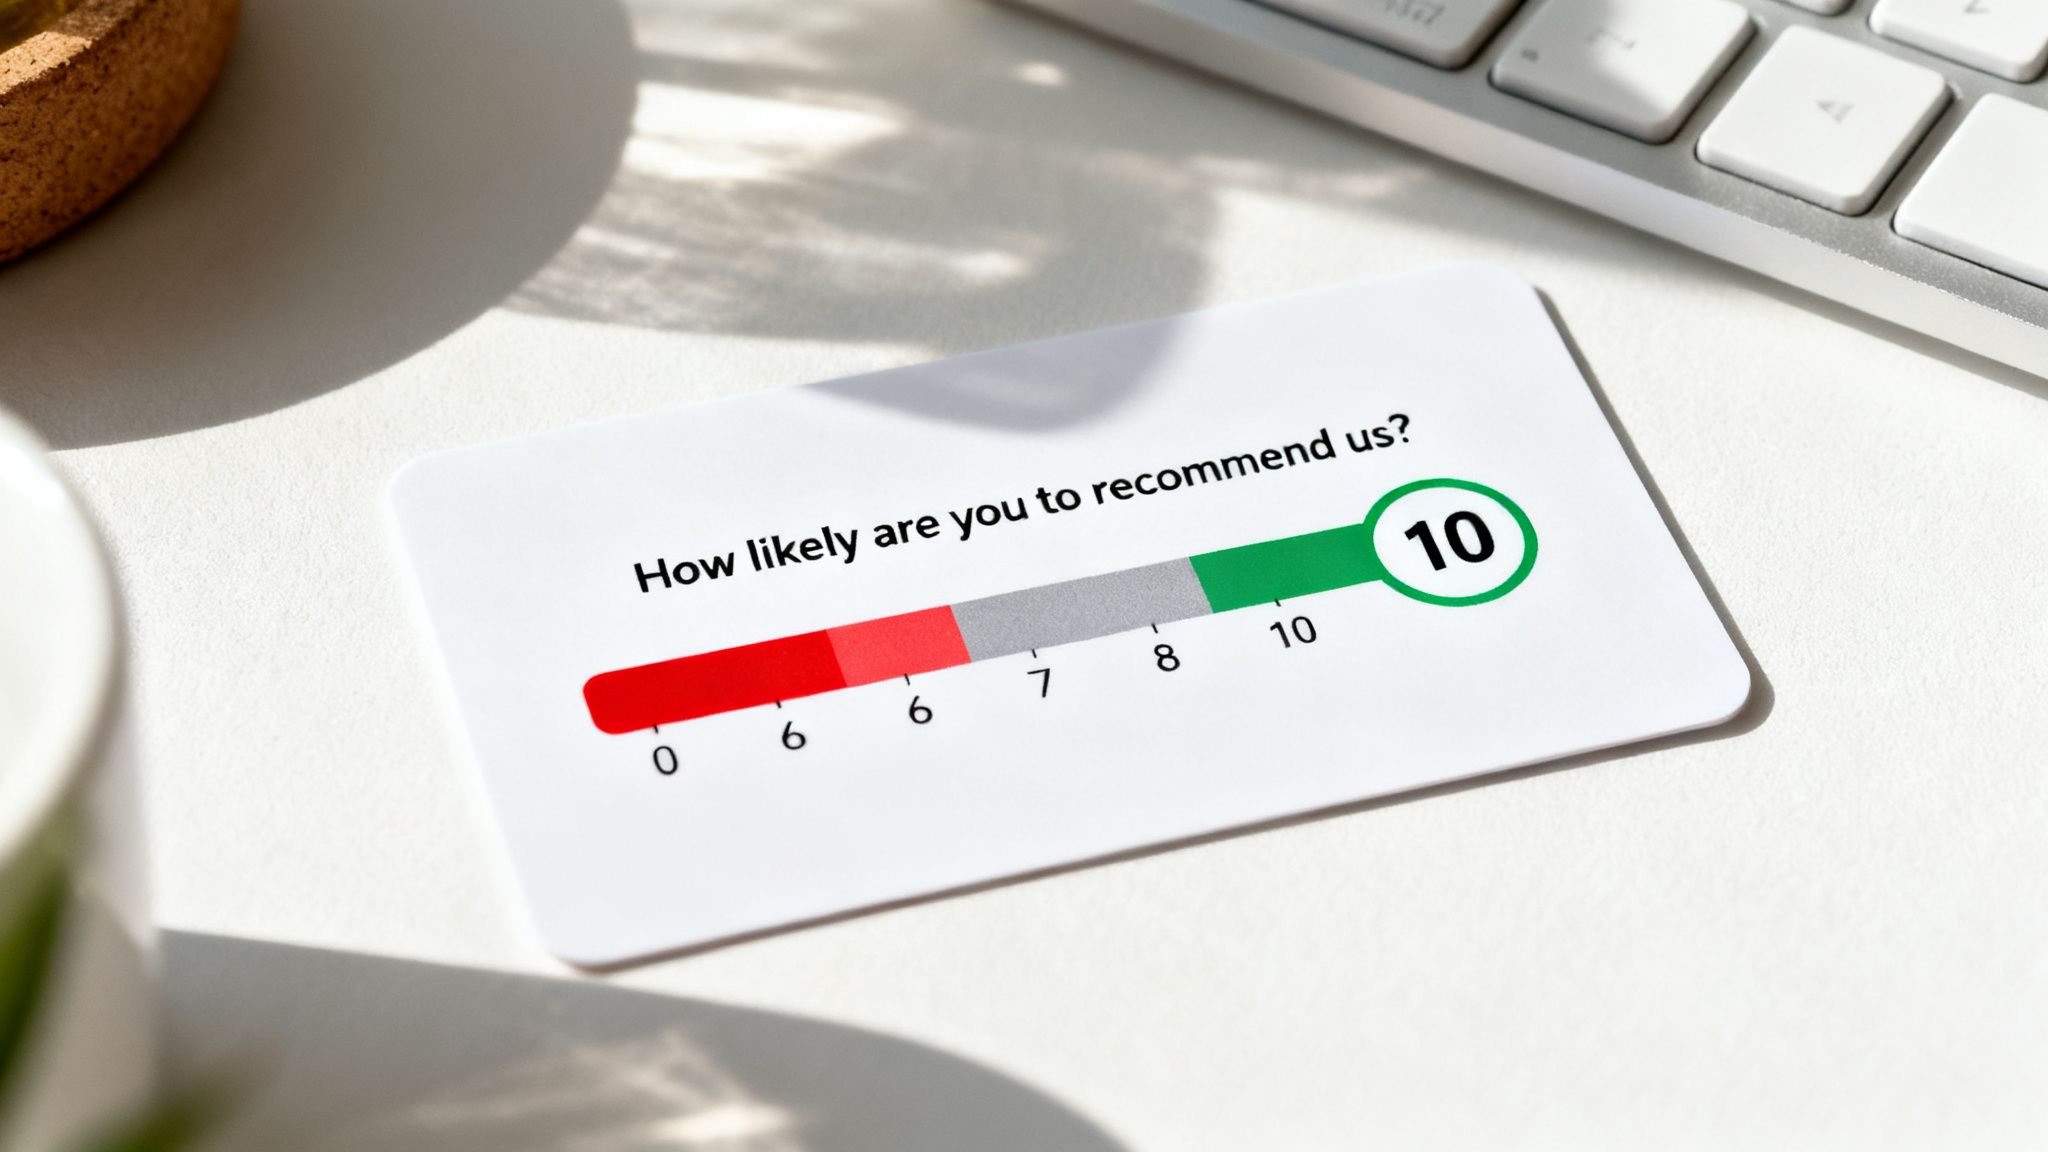
The Net Promoter Score (NPS) is a specialized 11-point Likert scale example (0-10) designed to measure customer loyalty with a single, powerful question: "How likely are you to recommend our business to a friend or colleague?" Developed by Fred Reichheld and Bain & Company, it has become a global standard for predicting business growth and gauging customer advocacy. The scale segments respondents into three distinct categories: Promoters (9-10), Passives (7-8), and Detractors (0-6).
Its strength is its simplicity and direct correlation with revenue growth. The final NPS score is calculated by subtracting the percentage of Detractors from the percentage of Promoters, yielding a score from -100 to +100. This straightforward metric is used extensively across retail, healthcare, and hospitality to provide a clear, high-level benchmark of customer sentiment.
Strategic Analysis & Application
The NPS scale's power comes from its segmentation. It doesn't just measure satisfaction; it identifies your brand advocates (Promoters), the indifferent customers at risk of churn (Passives), and the unhappy customers who can damage your reputation (Detractors). This provides a clear framework for targeted action.
Key Tactic: Always pair the NPS question with an open-ended follow-up: "What is the primary reason for your score?" This qualitative data is where the most valuable insights live. It reveals the 'why' behind the number, highlighting specific operational strengths to double down on or critical issues that need immediate attention.
How to Implement This Scale
Timing and context are everything for NPS. Deploy the survey immediately following a key interaction to capture fresh, accurate feedback.
Hospitality: "Based on your recent stay, how likely are you to recommend our hotel to others?" (0 'Not at all likely' to 10 'Extremely likely')
Restaurants: "How likely are you to recommend our restaurant to a friend or family member?" (0-10)
Healthcare: "After your appointment, how likely are you to recommend our clinic to someone seeking care?" (0-10)
Actionable Takeaways
Your NPS score is more than a number; it's a command to act faster. Use FeedbackRobot's AI Summaries to get instant insights & sentiment analysis from thousands of open-ended "why" responses, categorizing feedback into themes like 'Service Speed' or 'Room Cleanliness'. For Detractors who score you between 0-6, our Resolutions Engine—your tool for automated service recovery—can trigger a workflow, alerting a manager and sending a personalized apology to resolve the issue before they share their negative experience online.
4. Frequency Scale (Always/Often/Sometimes/Rarely/Never)
The frequency scale shifts the focus from feelings to facts, measuring how often a specific action or experience occurs. Instead of gauging agreement or satisfaction, this behavioral Likert scale example quantifies the consistency of service delivery. It uses anchors like "Always," "Often," "Sometimes," "Rarely," and "Never" to assess tangible actions.
This scale is exceptionally valuable for operational assessments, helping you understand if your service standards are being met consistently. It moves beyond subjective sentiment to provide clear, observable data on staff performance, process adherence, and the customer journey, making it a powerful tool for service-based industries.
Strategic Analysis & Application
The primary power of a frequency scale lies in its ability to pinpoint specific, recurring operational failures or successes. While a customer might be "dissatisfied," a frequency scale can tell you it’s because the staff "rarely" greeted them at the door or their orders were "sometimes" incorrect. This transforms vague feedback into a clear mandate for targeted staff training.
Key Tactic: Use "Sometimes" and "Rarely" responses as leading indicators of a systemic problem. If multiple customers report that a positive action "rarely" happens, it’s not an isolated incident; it's a gap in your process or training that requires immediate attention before it escalates.
How to Implement This Scale
To collect reliable data, you need to ask about specific, observable behaviors that are core to your brand promise.
Hospitality: "How often did our staff greet you with a smile during your stay?" (Always to Never)
Restaurants: "How often was your table checked on by your server after your food was delivered?" (Always to Never)
Healthcare: "Thinking about your recent visits, how often was your wait time less than 15 minutes?" (Always to Never)
Actionable Takeaways
Once you have frequency data, you must translate it into operational improvements. FeedbackRobot’s Radar dashboard provides unified review intelligence, showing you trends across all locations. You can instantly see if a "Rarely" or "Never" response pattern is isolated to one branch or is a company-wide issue. If a specific team is consistently underperforming on a key behavior, our Resolutions Engine can automatically assign a training module to the manager, ensuring the feedback loop is closed and standards are reinforced.
5. Importance/Priority Scale
While knowing if a customer is satisfied is crucial, understanding what they value most is the key to strategic resource allocation. The importance/priority scale is a specialized Likert scale that moves beyond sentiment to measure how critical specific attributes are to the customer experience, using anchors from "Not at all Important" to "Extremely Important."

This scale’s true power is unlocked when combined with satisfaction data. By plotting importance against performance, you create a powerful importance-performance matrix that instantly reveals what to fix now, what to maintain, and what can be deprioritized, ensuring your efforts are always focused on what drives loyalty.
Strategic Analysis & Application
The goal is to stop guessing where to invest your time and money. An importance-performance analysis provides a clear, data-driven roadmap for operational improvements, product development, and staff training, directly linking your actions to what customers care about most.
Key Tactic: Focus all immediate resources on the "High Importance, Low Satisfaction" quadrant. These are your critical weaknesses and the primary drivers of customer churn. For example, if "room cleanliness" is rated highly important but receives low satisfaction scores, it’s a red flag that demands immediate attention over a low-importance issue like "in-room minibar selection."
How to Implement This Scale
To create an effective importance-performance matrix, you must ask about both importance and satisfaction within the same survey. This dual-question approach gives you the paired data points needed for accurate analysis.
Retail/E-commerce: "How important is product selection when choosing where to shop?" (Not Important to Extremely Important)
Professional Services: "Please rate the importance of our team's responsiveness to your inquiries." (Not Important to Very Important)
Hospitality: "How important is the speed of the check-in process to your overall stay experience?" (Unimportant to Critically Important)
Actionable Takeaways
Transform this data into a strategic plan. FeedbackRobot's Radar helps you cross-reference importance scores with satisfaction ratings from all your channels. Use our AI Summaries for instant insights that categorize feedback into an importance-performance matrix, highlighting which high-priority areas are underperforming. When a low score on a critical attribute is detected, the Resolutions Engine can automatically assign a high-priority ticket to the relevant department manager, ensuring your most important issues get fixed fast.
6. Quality/Performance Scale (Poor to Excellent)
The Quality/Performance scale offers a direct, unambiguous way to measure customer perceptions of specific service or product attributes. Using a familiar "Poor" to "Excellent" spectrum, it avoids the emotional subjectivity of a satisfaction scale and instead focuses on a more objective assessment of quality. This makes it one of the most effective Likert scale examples for drilling down into operational performance.
Its power lies in its granularity. Instead of asking about an overall experience, it isolates individual components, such as room cleanliness in a hotel or the speed of service in a restaurant. This approach provides clear, targeted data that can be used to pinpoint exact areas for operational improvement, making it a favorite for detail-oriented managers in hospitality, retail, and healthcare.
Strategic Analysis & Application
The primary advantage of the "Poor to Excellent" scale is its directness. The language is simple and universally understood, reducing ambiguity for respondents and providing clear, actionable data for your team. It shifts the focus from a customer's feelings to their evaluation of your execution on key deliverables.
Key Tactic: Use this scale to create internal performance benchmarks for specific departments or locations. For example, if "Breakfast Quality" consistently scores lower than "Room Cleanliness" at one hotel property, you have a clear mandate to investigate and retrain the kitchen staff there, rather than implementing a company-wide initiative.
How to Implement This Scale
This scale is most effective when tied to tangible, observable aspects of your service. Instead of a general "How was your stay?" question, break the experience down into its core components to gather precise feedback.
Hospitality: "Please rate the cleanliness of your guest room." (Poor, Fair, Good, Very Good, Excellent)
Restaurants: "How would you rate the quality of the ingredients used in your dish?" (Poor to Excellent)
Retail: "Please rate the quality of the product you purchased." (Poor to Excellent)
Professional Services: "How would you rate the clarity of our communication during the project?" (Poor to Excellent)
Actionable Takeaways
Once you have this component-level data, the next step is to make it work for you. FeedbackRobot’s Radar aggregates these granular ratings from surveys and online reviews into one unified review intelligence dashboard, showing you exactly which operational areas are underperforming. If multiple customers rate "check-in efficiency" as "Poor," our Resolutions Engine can automatically assign a task to the front office manager to review staffing levels and processes, ensuring the issue is addressed before it impacts more guests.
7. Likelihood/Probability Scale (Very Unlikely to Very Likely)
The likelihood scale is a powerful predictive tool that shifts the focus from past experience to future intent. By asking customers how likely they are to perform a specific action, this format provides leading indicators for loyalty, retention, and revenue growth. It typically uses a 5-point spectrum from "Very Unlikely" to "Very Likely," bridging the gap between satisfaction and actual behavior.
This forward-looking approach is crucial for proactive business strategy. Instead of just knowing if a customer was happy, you learn if they plan to return, recommend your business, or spend more in the future. This data is invaluable for forecasting and identifying at-risk customers before they churn.
Strategic Analysis & Application
The primary advantage of the likelihood scale is its focus on tangible business outcomes. While satisfaction is important, it's the intention to act that directly impacts your bottom line. This scale transforms feedback from a simple report card into a strategic forecasting instrument.
Key Tactic: Segment customers who respond with "Very Likely" to recommend your services. These individuals are your most powerful brand advocates. Immediately enroll them in a loyalty or referral program to capitalize on their positive intent and turn their goodwill into new business.
How to Implement This Scale
Deploy this scale at key moments in the customer journey, particularly after a transaction or a positive service interaction, to capture intent when it is strongest. Use clear, action-oriented language to avoid ambiguity.
Retail/E-commerce: "How likely are you to make another purchase from us in the next 30 days?" (Very Unlikely to Very Likely)
Professional Services: "Based on our recent project, how likely are you to expand the scope of our services?" (Extremely Unlikely to Extremely Likely)
Hospitality: "How likely are you to book directly with us for your next stay?" (Very Unlikely to Very Likely)
Actionable Takeaways
Once you have this data, it's critical to act on both the positive and negative signals. Use FeedbackRobot's Radar to unify these likelihood scores with operational data, identifying which locations or service points are generating the most future revenue potential. If a high-value client indicates they are "Unlikely" to continue their engagement, our Resolutions Engine—your automated service recovery tool—can automatically assign a task to their account manager for immediate, personal follow-up, helping you prevent churn before it happens.
8. Experience/Value Scale (Poor Value to Excellent Value)
The experience/value scale is a crucial Likert scale example that moves beyond satisfaction to measure a customer's perception of worth relative to cost. It directly asks if the price paid was justified by the quality of the product, service, or experience received. This scale, with anchors from "Poor Value" to "Excellent Value," is essential for premium brands, professional services, and any business where price is a significant factor in the customer's decision.
This scale provides a clear indicator of price sensitivity and perceived return on investment. While a customer might be satisfied, they may not feel the experience was worth the money, signaling a potential retention risk. It helps businesses understand if their pricing strategy aligns with the value they deliver in the eyes of their customers.
Strategic Analysis & Application
The power of the value scale lies in its ability to link quality directly to price. It answers the critical question: "Did we provide enough value to justify what our customer paid?" This is especially vital in competitive markets where consumers have numerous alternatives at different price points. A high value perception is a strong defense against price-based competition.
Key Tactic: Segment your value perception data by customer demographics and spending tiers. You might discover that your entry-level offerings are perceived as excellent value, while your premium packages are seen as poor value. This insight allows you to adjust pricing, enhance features, or refine marketing messages to better communicate the worth of your higher-tier services.
How to Implement This Scale
This scale is most effective when the question provides context around the cost. The phrasing should guide the respondent to consider the price they paid when evaluating their experience, making the feedback direct and unambiguous.
Hospitality: "Considering the room rate, how would you rate the value for money of your stay?" (Poor Value to Excellent Value)
Professional Services: "Based on the outcomes achieved, how do you rate the value of our consulting fee?" (Poor Value to Excellent Value)
Healthcare: "Please rate the overall value you received considering the cost of your treatment." (Very Poor Value to Excellent Value)
Actionable Takeaways
After collecting value-focused feedback, the next step is to understand the drivers behind it. Use FeedbackRobot's AI Summaries to instantly process thousands of responses and pinpoint exactly why customers feel your service is either a great deal or overpriced. If value perception dips, our Resolutions Engine can trigger targeted follow-ups. For a guest who rated their stay as "Poor Value," you can automatically send a survey asking for more specific feedback on what fell short, offering a discount on a future visit to prove your commitment to delivering worth.
8 Common Likert Scales Compared
Scale | Implementation Complexity | Resource Requirements | Expected Outcomes | Ideal Use Cases | Key Advantages |
|---|---|---|---|---|---|
5-Point Satisfaction Scale | Low — simple question with five anchors | Minimal — little testing, mobile-ready | Reliable satisfaction snapshots; easy benchmarking | Pulse surveys, post-transaction CSAT | High completion; balance of simplicity and detail |
7-Point Agreement Scale | Medium — needs clear descriptors and numbering | Moderate — requires comprehension testing and visual clarity | Greater nuance in attitudes; richer statistical discrimination | Attitude/perception studies; complex service evaluations | Better captures intensity and discriminant validity |
10-Point NPS Scale | Low — single standard question but requires segmentation | Low–Moderate — follow-up open-ends and benchmarking needed | Net Promoter Score and loyalty prediction; cohort segmentation | Customer loyalty tracking; growth forecasting; benchmarking | Strong predictor of loyalty; actionable Promoter/Detractor segments |
Frequency Scale (Always→Never) | Low — behavior-focused anchors, straightforward wording | Moderate — needs specific observable statements to avoid bias | Operational patterns and consistency insights | Staff performance, service consistency measurement | Objective behavioral data; actionable for training and accountability |
Importance/Priority Scale | Medium — often paired with satisfaction for matrix analysis | Moderate — paired questions and quadrant analysis required | Priority rankings to guide resource allocation and strategy | Strategic planning, resource allocation, budget justification | Identifies high-impact improvements; supports ROI-focused decisions |
Quality/Performance Scale (Poor→Excellent) | Low — direct quality anchors, easy to implement | Minimal–Moderate — define descriptors for consistent interpretation | Specific quality assessments for operational improvement | Quality assurance, operational tracking, staff accountability | Universal language; highly actionable for operations and training |
Likelihood/Probability Scale | Low — intent-focused five-point anchors | Low–Moderate — best when combined with behavioral verification | Behavioral intent signals for retention, upgrade, or churn risk | Retention strategy, churn prediction, expansion opportunity ID | Stronger predictor of future behavior; enables proactive interventions |
Experience/Value Scale (Poor Value→Excellent Value) | Medium — requires context about price and expectations | Moderate — needs segmentation and contextual framing | Perceived value insights to inform pricing and positioning | Pricing strategy validation, value proposition testing, premium services | Direct pricing acceptability signal; predicts willingness to pay and repeat purchase |
Turn Your Feedback into Fuel: Here's How to Act Faster & Grow Stronger
Throughout this guide, we've explored the diverse landscape of Likert scale examples, from the classic 5-point satisfaction scale to the nuanced 7-point agreement and 10-point NPS scales. You now have a robust toolkit of ready-to-use templates for hospitality, retail, healthcare, and professional services. You have the foundational knowledge to craft questions that measure everything from customer satisfaction to service frequency.
However, the true value of these scales isn't just in the asking; it’s in the acting. Collecting data is only the first step. The ultimate goal is to transform those ratings into a powerful engine for continuous improvement. The difference between a good business and a great one lies in the speed and intelligence with which it responds to what it learns.
Beyond the Scale: From Data Collection to Intelligent Action
Mastering the perfect Likert scale question is a critical skill. But once the responses start rolling in, the real work begins. Without the right systems, even the most brilliantly designed survey can result in data that sits untouched, its potential wasted. This is where a dedicated Feedback Operating System becomes essential, bridging the gap between insight and impact.
Imagine these scenarios, powered by a system designed for action:
Automated Service Recovery: A guest at your hotel rates their stay a ‘2’ on a satisfaction scale. Instead of that feedback languishing in a weekly report, our Resolutions Engine immediately triggers a personalized apology email with a specific offer for their next stay. This is how you use automated service recovery to convert a detractor into a loyal advocate.
Proactive Trend Spotting: Multiple diners mention "cold coffee" in their post-meal surveys and online reviews. Radar, our unified review intelligence dashboard, detects this recurring keyword and sentiment, alerting your management team to a potential issue before it impacts dozens more customers.
Instant, Deep Insights: You receive hundreds of detailed comments. Instead of spending hours manually reading them, AI Summaries provides instant insights & sentiment analysis, telling you that "friendly staff" is your top strength while "checkout process" is the most common friction point.
This is the core philosophy of "collect smarter, act faster, and grow stronger." It’s about creating a dynamic loop where feedback directly fuels operational improvements, enhances the customer experience, and ultimately drives business growth.
Integrating Feedback into Your Daily Operations
For businesses using modern platforms like Mews for hospitality or Toast for restaurants, the opportunity for seamless integration is immense. By connecting your core operational software with a feedback system, you can automate the entire process.
Our Prompt to Survey feature leverages these integrations to send the perfect survey at the perfect moment. A guest checks out via Mews, and a satisfaction survey lands in their inbox. A customer pays their bill through Toast, and a request for a quick rating appears. This automation not only increases response rates but ensures the feedback is timely, relevant, and immediately actionable.
The Likert scale examples we’ve covered are your starting points. By pairing these proven questions with a powerful platform, you don’t just measure sentiment; you create a system that listens, understands, and responds in real-time. You build a business that is not just reactive, but proactively attuned to the voice of your customer.
Ready to stop just collecting data and start driving growth? FeedbackRobot is the Feedback Operating System designed to help you collect smarter, act faster, and grow stronger. Connect your tools, automate your responses, and uncover the insights you need to win.
What is a 5-point Likert scale example?
A classic example is: 1. Strongly Disagree, 2. Disagree, 3. Neutral, 4. Agree, 5. Strongly Agree. It's the gold standard for measuring sentiment depth.
Why is a 7-point scale sometimes better than a 5-point?
A 7-point scale offers more 'granularity' for highly engaged audiences, but it can be overwhelming for quick 'on-the-go' surveys like those in retail.
Should I always include a 'Neutral' option?
Generally, yes. Forcing a customer to pick a side when they truly feel 'meh' can lead to skewed data. A neutral option provides a safe 'middle ground.'
Can Likert scales be used for product testing?
Absolutely. They are great for gauging reactions to specific features, like: 'How easy was this button to find?' or 'How clear were the instructions?'
What is an 'Unipolar' vs 'Bipolar' Likert scale?
Unipolar measures the presence of one trait (Not at all helpful to Extremely helpful). Bipolar measures a range between opposites (Very Dissatisfied to Very Satisfied).