Customer Satisfaction Index: Formula & Benchmarks
A lot of service businesses think they already have a feedback system. What they have is a pile of disconnected signals.
A few Google reviews. A complaint told to the night manager. A comment card nobody entered into a spreadsheet. An email from a guest who never came back. A server who says table twelve “seemed unhappy.” None of that is useless. None of it is structured enough to run the business well.
If you run a hotel, restaurant, spa, clinic, or multi-location service brand, you need a repeatable way to turn customer sentiment into an operating metric. The customer satisfaction index format matters here. It gives you one disciplined framework for collecting feedback, comparing periods, spotting weak points, and deciding what gets fixed first.
Beyond Random Reviews Why You Need a Standardized CSI
Most operators start by chasing whatever feedback is loudest.
One angry review gets attention. A staff member mentions a rough shift. Someone in leadership decides the problem is probably speed, or training, or pricing. Then the team changes three things at once and still does not know what worked.
That is the cost of unstandardized feedback. You hear everything and understand very little.
Reviews are valuable, but they are incomplete
Public reviews are biased toward extremes. Internal comments are often anecdotal. Staff memory is selective. Email complaints arrive late, and by then the guest has already formed a lasting impression.
A Customer Satisfaction Index, or CSI, fixes that by creating a standard format for measurement. Instead of relying on scattered opinions, you ask the same core questions, on the same scale, across every guest interaction that matters.
The value is not just the score itself. The value is consistency.
With a consistent customer satisfaction index format, you can:
Track trends: See whether service is improving or slipping over time.
Pulse surveys are commonly used to track CSI scores on a weekly or biweekly basis without the overhead of a full survey cycle. Our pulse survey questions template includes the question formats and frequency benchmarks that work best.
Compare segments: Measure breakfast experience separately from check-in, housekeeping, table service, or delivery.
Spot root causes: Identify whether low satisfaction is tied to value, speed, cleanliness, or staff interaction.
Coach teams fairly: Base training on patterns instead of one-off complaints.
The best-known benchmark in this category is the American Customer Satisfaction Index, established in 1994. It surveys approximately 400,000 consumers across more than 400 companies annually, and its multi-attribute 1-10 scale averaged into a 0-100 index has become a foundational model for benchmarking customer satisfaction in the U.S. hospitality sectors include top performers scoring 82-85% in reported results (ACSI overview and methodology).
That matters because it shows this is not a vanity metric. It is a proven measurement structure.
Standardization changes how operators make decisions
When you standardize your CSI, you stop asking, “Did we get bad feedback this week?” and start asking better questions.
Which touchpoint is underperforming
Which location is drifting
Which team needs support
Which problem appears often enough to justify process change
That is a stronger management posture.
If you are building your measurement approach from scratch, start with a simple framework and make it consistent before adding complexity. This guide on guest satisfaction measurement is a useful companion if you want to connect CSI to the wider guest journey.
Practical rule: If two managers can collect feedback in two different ways, you do not have a system yet. You have opinions with branding.
Designing Your Customer Satisfaction Index Survey
A strong CSI survey is short, specific, and tied to the experience you deliver.
Too many operators either ask one vague question or ask so many questions that response quality collapses. Neither works. The right middle ground is a compact survey built around the few dimensions that shape satisfaction.
A standard customer satisfaction index format uses multi-attribute surveys on 1-10 scales across 4-8 dimensions such as product quality, service, and value. This format was formalized in the 1980s, and 85% of Fortune 500 firms use similar multi-factor CSI approaches for actionable insight (standard CSI format overview).
Use dimensions guests can judge clearly
For hospitality and service businesses, the survey dimensions should reflect the parts of the experience customers remember and can evaluate without confusion.
Good dimensions often include:
Overall satisfaction
Service quality
Staff professionalism
Speed or responsiveness
Cleanliness or environment
Value for money
Likelihood that the experience met expectations
How close the experience was to ideal
The mistake I often see is overlap. If you ask about “value,” “price fairness,” and “worth what you paid” in one short survey, you are asking the same thing three times. That muddies analysis and irritates respondents.
Why 1 to 10 works better than 1 to 5
A 1-10 scale gives guests more room to express nuance.
In service businesses, that matters. A guest may not think the room was “bad,” but they may still score cleanliness a 6 because the bathroom was fine and the carpet was not. A diner may rate food quality an 8 and service speed a 4. That level of granularity helps you diagnose the issue.
A 1-5 scale is simpler, but it compresses too much. When you need operational clarity, nuance beats simplicity.
Build around the core and add only what you will use
Your base survey should include the classic satisfaction anchors plus a handful of operational dimensions. Then add one open text question so guests can explain the score in their own words.
Here is a practical example for a hotel.
Dimension | Sample Question | Scale |
|---|---|---|
Overall satisfaction | How satisfied were you with your overall stay? | 1-10 |
Expectations | How well did your stay meet your expectations? | 1-10 |
Ideal experience | How close was your stay to your ideal hotel experience? | 1-10 |
Service quality | How would you rate the service you received from our team? | 1-10 |
Cleanliness | How would you rate the cleanliness of your room and common areas? | 1-10 |
Staff professionalism | How would you rate the professionalism and friendliness of our staff? | 1-10 |
Value for money | How would you rate the value of your stay for the price paid? | 1-10 |
Open feedback | What was the main reason for your score? | Open text |
Write questions that isolate one thing at a time
Good survey writing is operational writing. Each question should point to one department, one process, or one type of behavior.
Bad question:
Was your stay comfortable, convenient, and enjoyable?
Good questions:
How would you rate the cleanliness of your room?
How would you rate the speed of check-in?
How would you rate the helpfulness of our front desk team?
When one question mixes several ideas, the answer becomes hard to interpret. You cannot coach a team on a blended feeling.
For restaurants, I usually recommend a slightly different mix:
Overall experience: How satisfied were you with your visit?
Food quality: How would you rate the quality of your meal?
Service: How would you rate the attentiveness of your server?
Speed: How would you rate the timing of food and drinks?
Cleanliness and atmosphere: How would you rate the dining environment?
Value: How would you rate the value of your experience for the price paid?
Expectations: How well did your visit meet your expectations?
Open comment: What should we improve first?
Match survey timing to memory, not convenience
The survey should arrive when the experience is still fresh.
For hotels, post-stay works well because the guest can evaluate the full stay. For restaurants, the best timing is usually soon after the meal while details are still clear. For spas, clinics, and service appointments, send soon after the visit unless you also need delayed outcome feedback.
Do not batch and send everything the next week. Delayed memory creates vague responses.
Tip: If you would not trust a manager’s memory of a guest interaction seven days later, do not rely on the guest’s memory either.
Keep the survey short enough to finish
Operators often ask, “How many questions should we use?”
The better question is, “How many questions can we act on every week?” If your team cannot review, assign, and respond to findings from twelve dimensions, do not ask twelve dimensions.
A lean survey that gets completed is better than an ambitious survey that gets ignored. If you want deeper help shaping your questionnaire, this guide on best practices for survey design is worth reviewing.
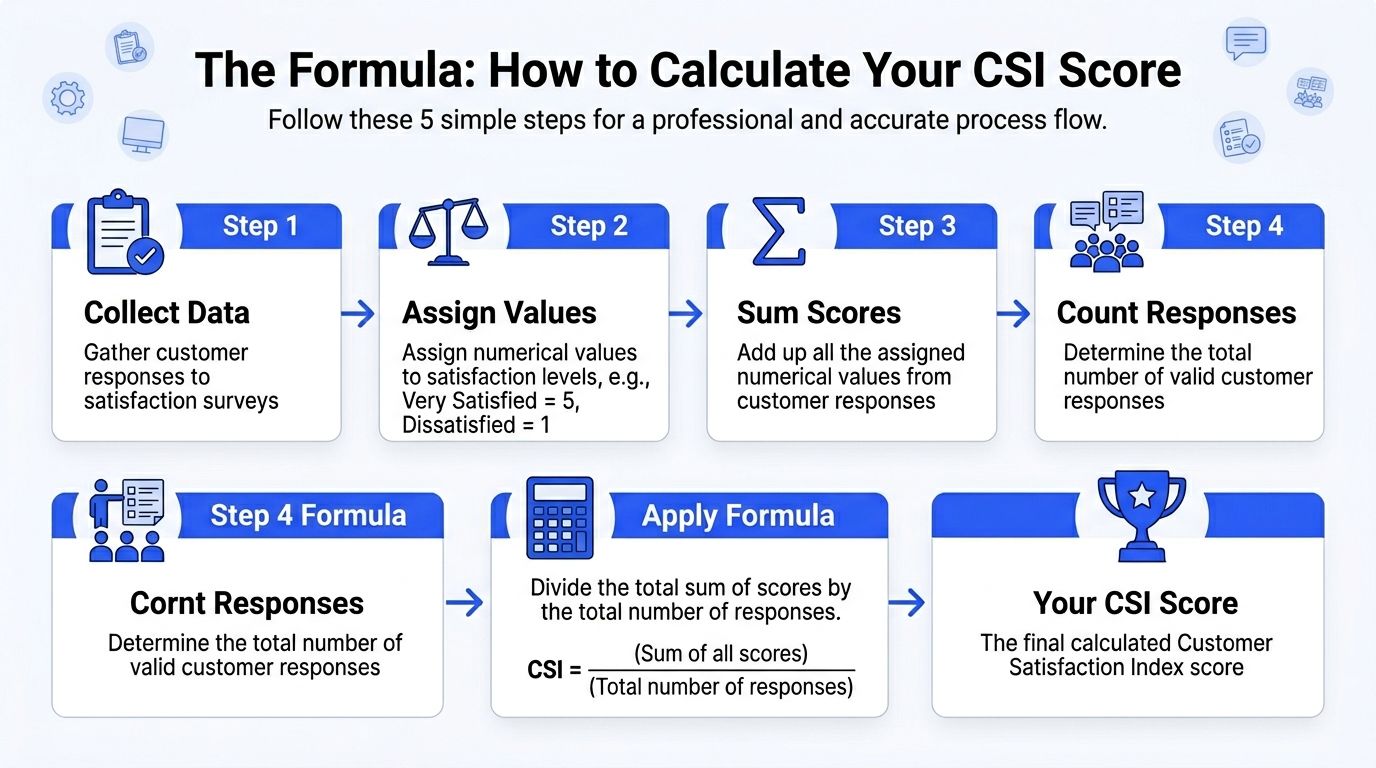
The Formula How to Calculate Your CSI Score
The math behind a customer satisfaction index format is simpler than most operators expect.
You do not need a data science team to calculate it. You need a clear method, clean survey design, and discipline about using the same formula every time.
Start with the three-question core
The standard CSI calculation uses three core 10-point scale questions. They measure overall satisfaction, whether expectations were met, and how close the experience was to ideal. Those responses are normalized into a 0-100 index using a basic formula such as [(Q1_avg + Q2_avg + Q3_avg)/3 * 10]. In this framework, scores over 80 indicate exceptional performance and are associated with 15-20% churn reduction (CSI calculation reference).
That gives you a clean, comparable index.
If your average scores are:
Overall satisfaction = 8.2
Met expectations = 7.8
Close to ideal = 7.5
Then:
CSI = (8.2 + 7.8 + 7.5) / 3 × 10
First, average the three scores: (8.2 + 7.8 + 7.5) / 3 = 7.83
Then convert to a 100-point scale: 7.83 × 10 = 78.3
That is your CSI score.
Use the simple average first
For most single-location operators and many growing groups, the simple average is enough to begin.
It is easy to audit. It is easy to explain to managers. It also removes a common failure point, which is overengineering a weighting model before the business has enough reliable responses.
A simple working setup looks like this:
Metric | Average score |
|---|---|
Overall satisfaction | 8.2 |
Expectations met | 7.8 |
Close to ideal | 7.5 |
CSI score | 78.3 |
You can calculate this in Excel, Google Sheets, a BI tool, or your survey platform.
Add attribute scoring for diagnosis
The core CSI gives you the headline number. Your additional attributes tell you why the score moved.
Suppose a restaurant tracks:
Food quality = 8.6
Service = 7.1
Speed = 6.4
Value = 7.3
The overall CSI may look decent, but the operational story is obvious. Speed is dragging the experience down. That tells the GM where to investigate first.
This is why a good customer satisfaction index format combines one summary score with a handful of diagnostic dimensions.
When weighted averages make sense
A weighted model is useful when you know some factors matter more than others.
In a quick-service setting, speed may matter more than ambiance. In a luxury hotel, room condition and service professionalism may carry more weight than price. In a clinic, communication and trust may matter more than décor.
A weighted formula follows the same logic, but each dimension has a different importance value. For example, if speed matters more than atmosphere, you would give speed a higher weight in the calculation.
Use weighting only when you have a clear reason and enough survey history to justify it. If leadership assigns weights based on intuition alone, the score can become less credible, not more.
Practical rule: Start unweighted. Move to weighted only after your team agrees on what the weights mean and why they exist.
Build a spreadsheet that managers can trust
Your first CSI tracker does not need to be fancy. It needs to be readable.
Use columns like:
Response ID | Date | Location | Overall satisfaction | Expectations met | Ideal experience | Service | Cleanliness | Value | CSI |
|---|
Then calculate:
Row-level CSI for each response if needed.
Weekly or monthly averages by location or department.
Trend lines across time.
What matters most is consistency. If one month you use completed stays only, and the next month you mix in walk-ins, the trend becomes harder to interpret.
From Score to Strategy Interpreting Your CSI Results
A CSI score is useful only if it changes decisions.
Too many businesses stop at reporting. They circulate a dashboard, discuss whether the number is “good,” and move on. That is not management. That is observation.

Read the score in context
A rigorous CSI method has forecasting value. The ACSI-style cause-effect framework helps businesses benchmark performance and diagnose drivers of loyalty and churn. It has been proven scalable across over 400 companies, with example industry averages including retail at 74 and hotels at 77 (ACSI methodology and benchmarking detail).
That does not mean a hotel should chase a benchmark blindly. It means the score has value only when tied to the drivers underneath it.
A hotel with a CSI of 77 might be stable, slipping, or recovering. The same number can mean three different things depending on trend and comments.
Trends matter more than one snapshot
One month of feedback can mislead you.
A renovation period, a staffing issue, a weather event, or a local surge can distort a short window. Operators should review CSI over time and compare it against known operating conditions.
Look for patterns such as:
A steady decline in one location
A repeated dip on certain weekdays
A low score tied to one touchpoint
A gap between internal assumptions and customer comments. Raw data often becomes unmanageable for manual review in such cases. If you are analyzing survey patterns regularly, the discipline in this analysis of survey data guide is useful because it pushes teams to separate signal from noise.
Separate the headline from the driver
The best way to interpret CSI is to split it into two layers.
First layer:
Your overall CSI score
Second layer:
The operational reasons behind it
If the score drops, ask:
Did one dimension fall sharply?
Did one location skew the average?
Did the open comments mention the same issue repeatedly?
Did this happen during a staffing or process change?
That approach keeps managers from overreacting.
Build an action review around exceptions
I recommend a simple weekly review rhythm.
Review question | What to check |
|---|---|
What moved? | CSI by week or service period |
Where did it move? | Location, outlet, shift, department |
Why did it move? | Low-scoring attributes and comment themes |
What should change? | Training, staffing, process, communication |
Who owns it? | Named manager and follow-up date |
The key is ownership. A CSI report without an owner is just decoration.
Here is a useful way to think about interpretation:
Stable score, weak comments: Your average may be hiding a recurring irritation.
Lower score, strong comments: You may have a narrow but fixable problem.
Improving score, same complaint theme: The process may be getting better, but not fast enough.
High score, no operational follow-through: You are missing the chance to turn strength into reputation.
The video below gives a helpful visual frame for turning business feedback into practical management insight.
Key takeaway: Do not ask whether your CSI is good. Ask whether it is improving, what is driving it, and which manager is responsible for the next correction.
Act Faster Automating CSI Collection and Service Recovery
Manual feedback systems fail at the exact moment speed matters most.
A guest has a poor check-in, a delayed meal, a billing issue, or an unfriendly interaction. If the business waits for a public review, a staff debrief, or a monthly report, the recovery window is already closing. Operators need a workflow that captures feedback fast and routes it to the right person without delay.
Automation belongs inside the customer satisfaction index format, not beside it.

Trigger collection from real operational events
The most reliable survey systems are event-based.
In a hotel, the trigger might be checkout. In a restaurant, it might be receipt close. In a spa or clinic, it might be appointment completion. Once the trigger is tied to the service event, response collection becomes consistent and scalable.
That matters for busy teams. Front desk staff should not have to remember who got a survey. Restaurant managers should not have to export last night’s guest list and send links manually.
Common trigger examples include:
Hotel checkout: Send a post-stay CSI survey after departure
Restaurant payment: Send a short visit survey after the bill closes
Service completion: Send after a treatment, appointment, or job is marked done
Complaint closure: Ask whether the resolution met expectations
For operators looking at integration-heavy workflows, pairing feedback operations with systems like Mews or Toast becomes especially useful. The survey should follow the transaction automatically, not depend on staff memory.
Choose the right channel for the setting
The best channel depends on guest behavior.
A resort may do well with email after checkout. A casual dining brand may prefer SMS because the decision window is shorter. A café or quick-service concept may use QR codes on receipts or table tents to catch feedback while the experience is still fresh.
The goal is not maximum volume. The goal is timely, usable responses.
Use the channel your customer will open, and keep the first screen friction low.
Low scores need workflows, not sympathy
Modern systems become operational tools instead of survey tools here.
Businesses collect dissatisfaction and then do nothing operational with it. Someone reads the comments later. Maybe. Or a manager replies to a review after the guest has already told five friends about the bad experience.
A proper service recovery system should define exactly what happens when a low score arrives.
For example:
Trigger | Automated response |
|---|---|
Low CSI response | Alert location manager |
Complaint mentions billing | Route to front office or accounts team |
Complaint mentions food quality | Route to kitchen leadership |
Guest requests contact | Create follow-up task |
Positive comment | Request review or save for marketing approval |
This is why modern systems become operational tools instead of survey tools.
What works in practice
The operators who recover fastest usually follow the same principles:
Immediate triage A low score should create visibility the same day. Waiting for a weekly report wastes the best recovery window.
Named ownership One person must own follow-up. Shared inboxes without assignment rules create silence.
Response templates with room for judgment Staff need a starting point for apologizing and responding, but not a robotic script that makes the guest angrier.
Issue categorization If every complaint is “general dissatisfaction,” nobody can spot patterns across locations or teams.
Closed-loop review Managers should be able to see whether a complaint was acknowledged, resolved, and learned from.
Tip: Fast service recovery is not about saying sorry faster. It is about getting the right issue to the right person before the customer decides you do not care.
Automation also protects positive experiences
Many teams think only about saving unhappy guests. That matters, but automation also helps with happy guests.
When a guest leaves a strong score and a positive comment, that is the best time to invite a public review, request a testimonial, or flag the feedback for internal recognition. Good systems do not treat positive feedback as passive praise. They treat it as fuel for reputation, team morale, and repeat business.
Where FeedbackRobot fits in operationally
FeedbackRobot becomes useful here.
Prompt to Survey helps teams generate ready-to-send survey drafts quickly. Instead of building every questionnaire manually, you can create structured feedback flows for a boutique hotel, restaurant group, or clinic with a simple prompt and then refine the wording for your operation.
Radar acts as a unified review intelligence layer. It brings survey responses together with public review signals so managers can see the relationship between internal satisfaction trends and what customers are saying in public.
AI Summaries condense incoming comments into usable insight. That matters when managers do not have time to read every line of text but still need to know whether complaints cluster around housekeeping, speed, communication, or value.
Resolutions Engine is where service recovery becomes operational. It can automate the next step after a low score, such as routing the issue, prompting a response, or launching a follow-up workflow so the team acts before the complaint goes stale.
Those four pieces matter because they support the full operating cycle: collect smarter, act faster, and grow stronger.
Grow Stronger Turning Positive Feedback into Your Best Marketing
A strong CSI program should not end with issue detection.
Once you consistently identify satisfied guests, you have a marketing asset that most businesses underuse. Positive comments are proof. They show future customers what your brand delivers when the operation works well.
Static testimonials copied onto a website rarely help much. They get old, they look curated, and they lose credibility. A better approach is to display recent, relevant customer praise in a format that feels alive.
Spotlight: Feedback Wall has real value. Instead of manually collecting a few quotes and forgetting to update them, you can curate strong feedback into a live proof layer on your site. For hotels, that might mean showcasing praise about check-in, room comfort, or staff warmth. For restaurants, it might mean featuring comments about service, food quality, and atmosphere.
This closes the operational loop.
You collect feedback in a standard format.
You detect issues and recover quickly.
You identify what guests love.
You turn that praise into trust for the next buyer.
FeedbackRobot supports that full cycle with tools built for action, not just reporting. Radar gives teams a unified view of review and survey intelligence. Prompt to Survey speeds up survey creation when you need a clean starting point. AI Summaries helps managers absorb themes quickly. Resolutions Engine makes low-score follow-up systematic instead of improvised. Spotlight: Feedback Wall then helps turn earned praise into visible social proof.
If you want to strengthen the public side of your reputation, it is also worth exploring FeedbackRobot’s free tools from the site’s resource library and sitemap. The most useful tool is the one your team will use every week.
If you want to build a customer satisfaction index format that your team can run, start with a system built for operations. FeedbackRobot helps you create surveys faster, centralize feedback, spot patterns, automate service recovery, and turn positive experiences into social proof with Spotlight: Feedback Wall. Start your FeedbackRobot free trial and see how quickly a smarter feedback operating system can improve the way you collect, respond, and grow.
What is the tactical advantage of using a 10-point scale instead of the traditional 5-star rating for hospitality and healthcare feedback?
A 10-point scale provides the granularity necessary to distinguish between "acceptable" and "exceptional" service, which a 5-point scale often compresses into a single, vague middle category. In high-touch environments like clinics or luxury hotels, nuance is vital for diagnostics; for instance, a guest might rate cleanliness as a 6 because of a minor oversight, whereas a 1-5 scale would likely force that rating into a 3 (average) or 4 (good), masking the specific operational deficit. This extra room for expression allows leadership to identify subtle downward trends before they manifest as critical service failures.
How does the specific Customer Satisfaction Index calculation normalize disparate data points into a single 0-100 metric?
The standard CSI framework focuses on three core anchors: overall satisfaction, the degree to which expectations were met, and how closely the experience mirrored the customer's "ideal." By averaging these three 10-point variables and multiplying the result by 10, the system produces a 0-100 index. The formula is expressed as:$$CSI = \left(\frac{\text{Satisfaction} + \text{Expectations} + \text{Ideal}}{3}\right) \times 10$$This normalization provides a high-level "headline" number that is easily comparable across different departments or locations, while still being rooted in statistically significant drivers of loyalty.
In a multi-location service environment, how should managers differentiate between "headline scores" and "diagnostic attributes" during performance reviews?
Leadership must treat the headline CSI as a barometer of brand health and the diagnostic attributes—such as speed, staff professionalism, or cleanliness—as the roadmap for specific training interventions. If a restaurant's overall CSI is slipping, managers should look at the individual attribute scores to isolate the variable. For example, if "Food Quality" remains high but "Speed of Service" has dropped significantly, the intervention should focus on kitchen throughput or expo-line staffing rather than a general, and likely ineffective, "do better" mandate to the entire team.
Why is event-based automation considered superior to manual or batch-sent survey distributions?
Accuracy in feedback is directly tethered to the "memory decay" of the participant; therefore, triggering a survey immediately upon a checkout, payment, or appointment completion captures data while the sensory details are still fresh. Manual batching—sending all surveys at the end of a week, for example—leads to "vague responses" where guests can no longer recall the specific nuances of their interaction. Automating these triggers through integrations like Mews or Toast ensures a consistent flow of high-quality data without burdening frontline staff with the responsibility of collection.
Beyond resolving complaints, how can an organization operationally leverage high CSI scores to drive new customer acquisition?
A mature CSI program transforms internal praise into a public marketing asset by closing the loop between satisfaction and social proof. When a guest provides a high score and positive sentiment, tools like Spotlight: Feedback Wall allow businesses to curate and display that real-time praise directly on their website. This moves beyond static, outdated testimonials by showing prospective clients a live "proof layer" of recent, authenticated experiences, effectively turning high operational performance into a primary engine for brand trust and customer conversion.