
In the hospitality and service world, you know that exceptional customer experiences are the foundation of your business. But are you measuring what truly matters? Gut feelings and anecdotal evidence won't cut it when a single bad review can damage your reputation and impact your bottom line. To thrive, you need to move from hoping you're doing well to knowing exactly where you stand, what your customers think, and how your team is performing.
This requires a clear-eyed focus on the right key performance metrics for customer service. These aren't just abstract numbers for a spreadsheet; they are the vital signs of your business. They are concrete indicators that tell you precisely where you're excelling and where you're at risk of losing valuable customers. Tracking these KPIs helps you pinpoint operational weaknesses, reward high-performing staff, and make data-driven decisions that directly improve guest loyalty and profitability.
This guide is your action plan. We will cut through the noise and break down the 10 most critical metrics for any service-focused business, from hotels and restaurants to retail stores and professional services firms. For each metric, we'll provide the formula, industry benchmarks, and practical steps for tracking. We'll also show you how a Feedback Operating System like FeedbackRobot helps you collect smarter, act faster, and grow stronger. For example, our Radar feature unifies all your feedback into a single dashboard, giving you a clear, real-time view of these essential metrics. It’s time to stop guessing and start measuring what drives growth.
1. Customer Satisfaction Score (CSAT)
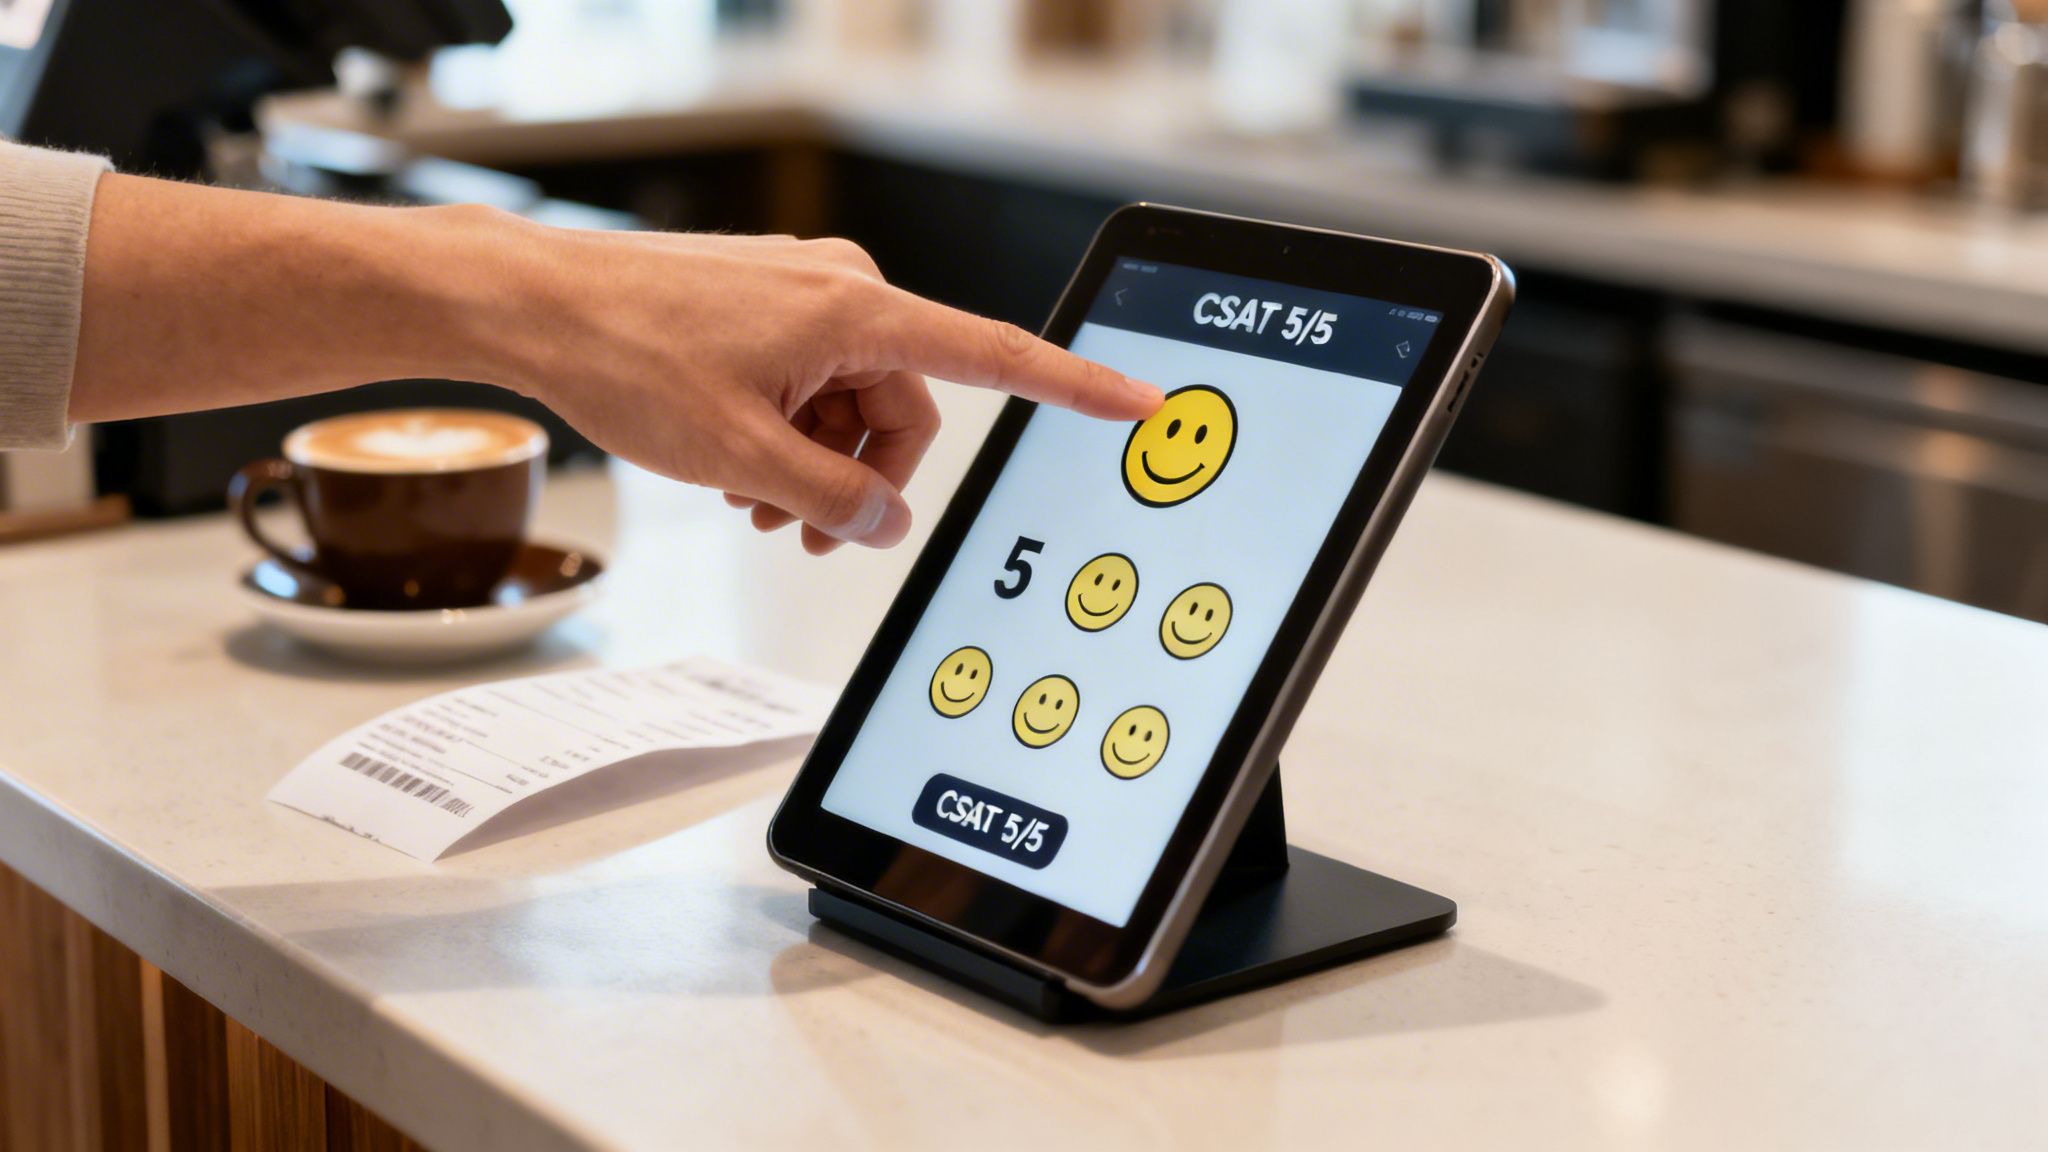
Customer Satisfaction Score (CSAT) is a foundational customer service metric that gauges immediate happiness with a specific interaction, product, or service. It directly answers the question, “How satisfied were you?” typically using a simple 1-to-5 or 1-to-10 scale. This metric's power lies in its immediacy and simplicity, providing a real-time pulse on transactional quality. For businesses where the customer experience is the product, like restaurants, hotels, and retail stores, CSAT is a direct indicator of whether you’ve met customer expectations at that critical moment.
How to Calculate and Use CSAT
Calculating your CSAT score is straightforward. You divide the number of satisfied customers (those who gave a positive rating, e.g., 4 or 5 on a 5-point scale) by the total number of responses and multiply by 100 to get a percentage.
Formula:
(Number of Satisfied Customers / Total Number of Responses) x 100 = % of Satisfied Customers
While measuring the Customer Satisfaction Score (CSAT) is vital, understanding effective strategies to increase customer satisfaction will directly impact this metric and overall customer loyalty. A high score suggests your team is performing well, while a dip can be an early warning of an issue with a specific process, location, or team member.
Putting CSAT into Action
Effectively gathering and acting on CSAT data is one of the most important key performance metrics for customer service you can track. Here’s how to make it work for you:
Deploy Immediately: Trigger surveys via text, email, or a QR code right after the interaction ends, such as at hotel checkout or after a meal. This immediacy ensures feedback is fresh and accurate.
Keep It Short: A single CSAT question followed by an optional open-ended comment field maximizes response rates. People are more likely to answer one quick question.
Segment Your Data: Don’t just look at the overall score. Segment CSAT by location, service type, or employee to pinpoint excellence and identify specific areas needing improvement.
Automate Analysis: Manually reading every open-ended comment is impossible at scale. FeedbackRobot’s AI Summaries provide instant insights & sentiment analysis, analyzing all comments tied to your CSAT scores and identifying recurring themes (e.g., “slow service,” “friendly staff”) so you know exactly what’s driving your scores up or down without spending hours on manual review.
2. Net Promoter Score (NPS)
Net Promoter Score (NPS) moves beyond immediate satisfaction to measure long-term customer loyalty. It gauges a customer's willingness to recommend your business to others by asking a single, powerful question: “On a scale of 0-10, how likely are you to recommend our company/product/service to a friend or colleague?” This metric is a strong predictor of business growth and brand health, making it one of the most vital key performance metrics for customer service for any organization focused on building lasting relationships, from premium hotels to professional services firms.

How to Calculate and Use NPS
Respondents are grouped into three categories based on their score: Promoters (9-10), Passives (7-8), and Detractors (0-6). The NPS is then calculated by subtracting the percentage of Detractors from the percentage of Promoters, resulting in a score that can range from -100 to +100.
Formula:
(% of Promoters) - (% of Detractors) = Net Promoter Score
While the score itself is a valuable benchmark, the real insight comes from understanding the why behind it. Benchmarks vary significantly by industry. A positive and growing NPS indicates healthy customer loyalty, while a stagnant or negative score signals a risk of churn and negative word-of-mouth.
Putting NPS into Action
Measuring NPS is the first step; acting on the feedback is what drives growth. Here’s how to make your NPS program effective:
Ask "Why?": Always follow the "how likely" question with an open-ended "Why did you give that score?" This qualitative feedback is where the most actionable insights are found.
Segment Your Score: Analyze NPS by customer cohort, location, or service type. A retail chain might discover one region has a much lower NPS, pointing to a local operational issue that needs attention.
Focus on Detractors: These customers are at high risk of churning and spreading negative feedback. Create specific action plans to address their concerns, turning a negative experience into a chance to demonstrate your commitment to service.
Automate Insight Discovery: Manually sorting through thousands of "why" responses is inefficient. FeedbackRobot's AI Summaries provide instant insights & sentiment analysis by analyzing all open-ended feedback tied to your NPS scores, categorizing detractor complaints (e.g., “billing issues,” “staff attitude”) and promoter praise (e.g., “fast checkout,” “excellent advice”), so you can act faster on what matters most.
3. Customer Effort Score (CES)
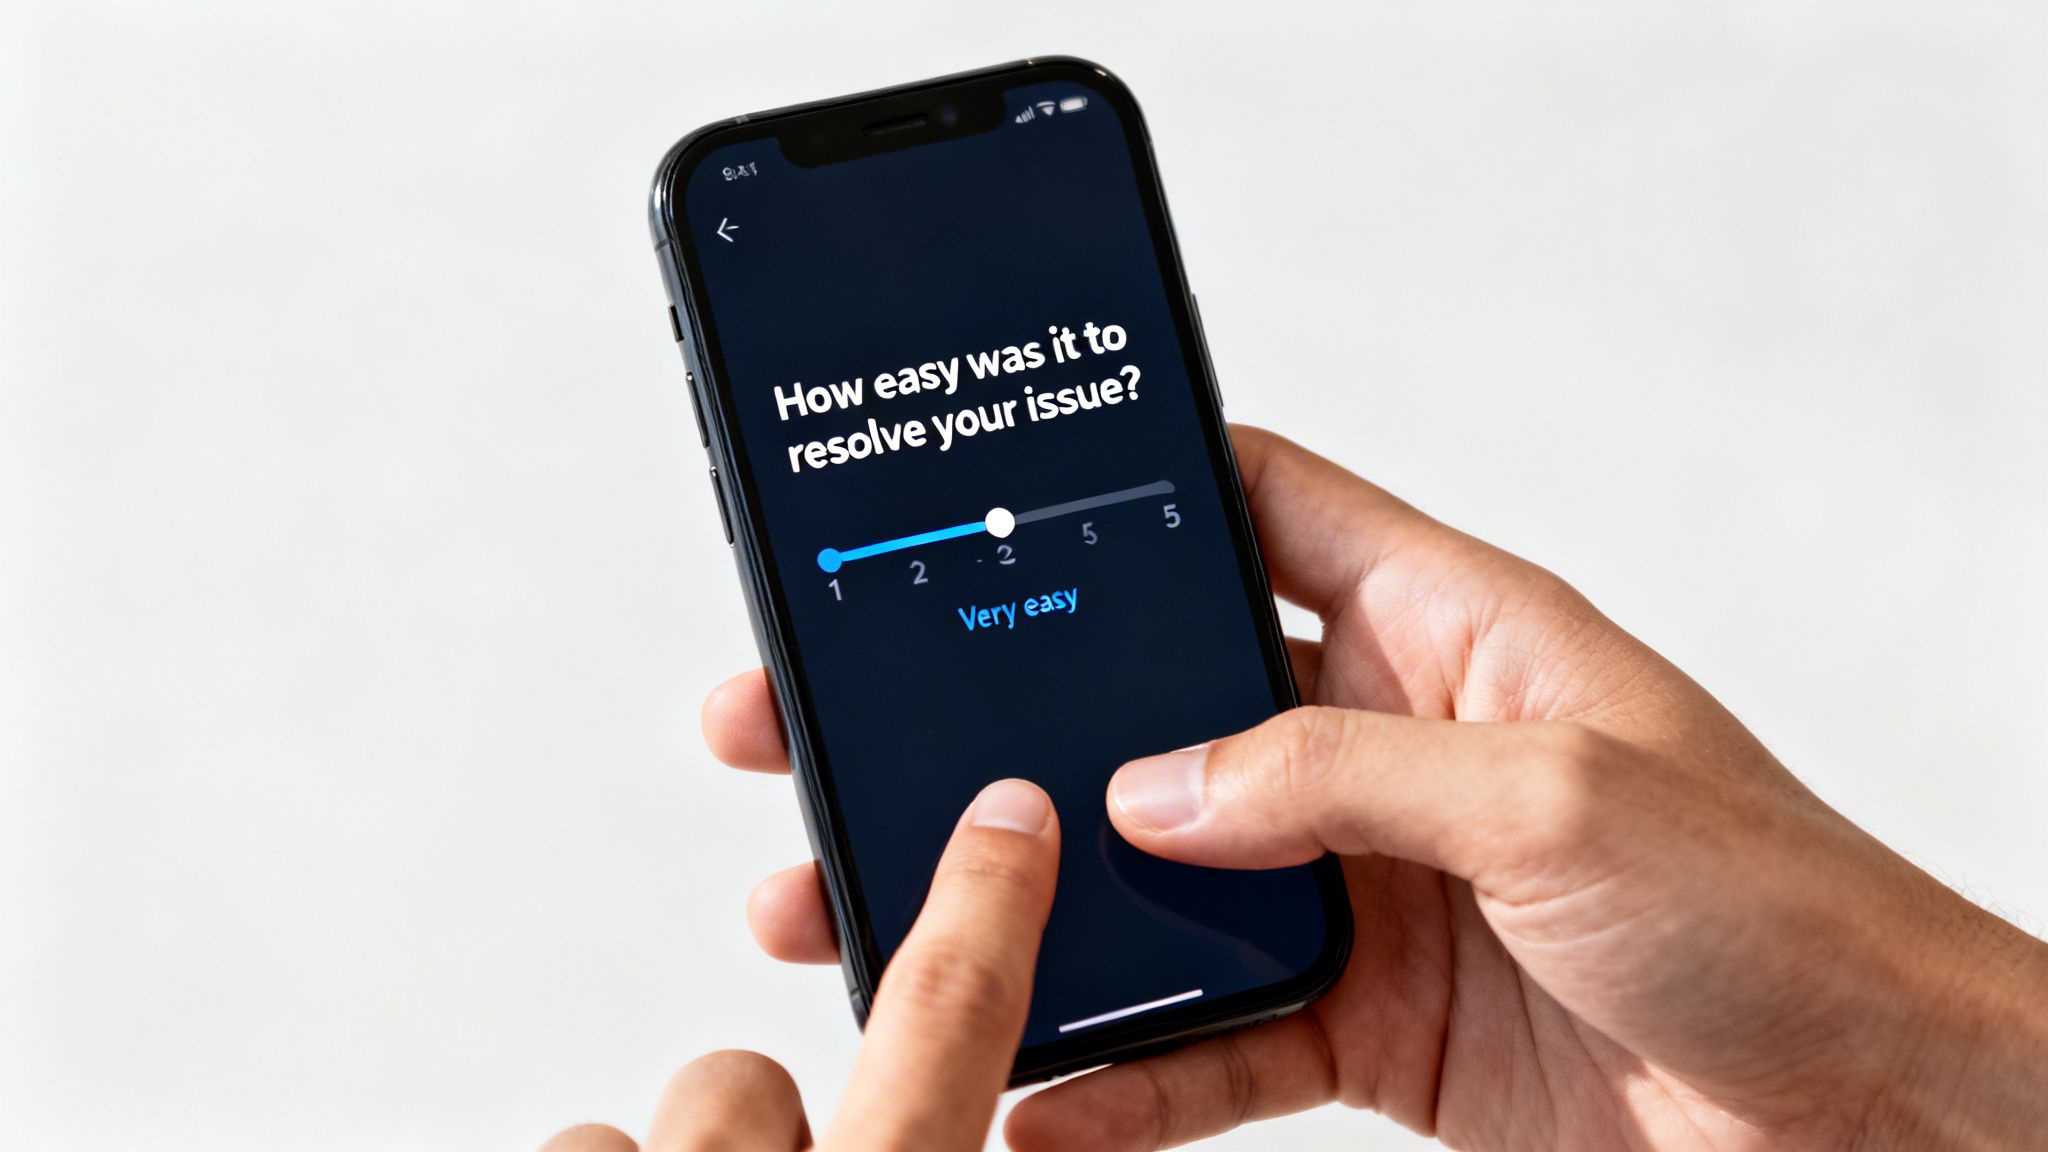
Customer Effort Score (CES) measures how easy it is for a customer to get their issue resolved, complete a purchase, or interact with your business. Instead of asking about satisfaction, CES directly addresses customer friction by asking, “How easy was it to handle your request?” typically on a 1-to-7 scale from 'Very Difficult' to 'Very Easy'. Research shows that reducing effort is a powerful driver of customer loyalty, often more so than delighting them. For any service business, from hotels managing check-ins to retail stores processing returns, minimizing effort is a critical goal.
How to Calculate and Use CES
To calculate CES, you find the average of all your responses. You sum up all the scores and divide by the number of responses. The goal is to achieve a high average score, indicating a low-effort experience.
Formula:
(Sum of all scores) / (Total number of responses) = CES Score
While the score itself is a simple average, the real value comes from acting on it. A high-effort experience is a major red flag for potential churn. To dig deeper, you can learn more about what Customer Effort Score is and how to apply it to your operations.
Putting CES into Action
Tracking CES is one of the most practical key performance metrics for customer service because it gives you a direct roadmap for process improvement. Here’s how to make it work:
Deploy at Key Moments: Send a CES survey immediately after a specific task is completed, like after an online order, a support ticket is closed, or a guest checks out.
Ask "Why?": Always follow a low CES score with an open-ended question like, “What made this process difficult?” This provides the context you need to fix the friction points.
Segment Your Analysis: Analyze CES for different journey stages, such as booking, check-in, and support. This helps you identify which specific processes are causing the most customer effort.
Pinpoint Friction with AI: Instead of manually sifting through comments, FeedbackRobot's AI Summaries deliver instant insights & sentiment analysis on feedback tied to CES scores. The system identifies recurring themes like “confusing website navigation” or “long wait for return approval,” showing you exactly what to fix to make things easier for your customers.
4. First Response Time (FRT) / Response Time
First Response Time (FRT) measures the speed at which your team provides an initial reply to a customer's inquiry or comment. This metric is a direct reflection of your company's attentiveness and is crucial for shaping customer perception from the very first interaction. In service-focused industries like hospitality, restaurants, and retail, a fast response demonstrates that you value the customer's time and are prepared to address their needs, significantly impacting satisfaction and preventing minor issues from escalating.

How to Calculate and Use FRT
Calculating FRT involves finding the average time elapsed between when a customer sends a message and when they receive their first human response. It is typically measured in minutes or hours and calculated separately for different communication channels.
Formula:
Total Time to First Response for all Tickets / Total Number of Tickets = Average FRT
A low FRT is one of the most important key performance metrics for customer service because it sets a positive tone for the entire customer journey. A prompt reply, even if it's just to acknowledge the issue, reassures customers that they have been heard. For instance, a hotel committing to a 2-hour response for guest complaints or a restaurant replying to a negative review within 24 hours shows a strong commitment to service quality.
Putting FRT into Action
Monitoring and improving your FRT requires a coordinated strategy to ensure no customer communication falls through the cracks. Here’s how you can make it a strength:
Set Channel-Specific Goals: Establish realistic FRT targets based on customer expectations for each channel. For example, aim for under 5 minutes on live chat, under 1 hour for social media DMs, and within 24 hours for emails.
Centralize Communications: Juggling multiple platforms (email, social media, review sites) leads to missed messages and slow replies. FeedbackRobot's Radar feature provides unified review intelligence, consolidating all customer feedback and direct messages into one place so your team can respond faster without switching tabs.
Prioritize Urgent Issues: Not all inquiries are equal. Use your system to flag urgent messages, such as negative reviews or service complaints, so your team can prioritize them and minimize potential damage to your brand’s reputation.
Use Smart Acknowledgments: Implement automated replies that confirm receipt and set a clear expectation for when the customer will get a personal response (e.g., “Thanks for your message! Our team will get back to you within 4 business hours.”). This immediately satisfies the customer’s need for an initial acknowledgment.
5. First Contact Resolution (FCR)
First Contact Resolution (FCR) measures the percentage of customer issues resolved during the very first interaction, eliminating the need for any follow-up contact. It is a powerful indicator of efficiency and effectiveness, answering the critical question, “Did we solve the problem on the first try?” A high FCR score demonstrates that your team is well-trained, empowered, and equipped with the right tools to handle guest needs promptly. For any service business, from hotels and restaurants to healthcare practices, achieving a high FCR directly boosts customer satisfaction while lowering operational costs by reducing repeat inquiries.
How to Calculate and Use FCR
Calculating your FCR rate is a direct measure of your team's problem-solving ability. You divide the total number of issues resolved in a single interaction by the total number of customer issues reported and multiply by 100 to get a percentage. This metric is among the most important key performance metrics for customer service because it links directly to both customer happiness and operational efficiency.
Formula:
(Total Issues Resolved on First Contact / Total Number of Issues) x 100 = FCR %
A high FCR means customers leave satisfied and your team spends less time on follow-ups, freeing them to handle new guest needs. A low rate often signals gaps in training, a lack of authority for front-line staff, or inadequate knowledge management systems that force escalations.
Putting FCR into Action
Tracking and improving FCR is essential for delivering a seamless customer experience and running an efficient operation. Here’s how to make it a central part of your service strategy:
Ask Directly: The most reliable way to measure FCR is to ask the customer. Use a post-interaction survey to ask a simple question like, “Was your issue fully resolved today?”
Empower Your Team: Give front-line staff the authority to handle common problems like room changes, bill adjustments, or complimentary offers without needing a manager’s approval. This autonomy is key to immediate resolutions.
Analyze Unresolved Cases: Don’t just track the score; investigate the failures. Use FeedbackRobot's AI Summaries to get instant insights & sentiment analysis on comments from unresolved interactions. The AI will instantly pinpoint recurring reasons for follow-ups, such as “needed manager approval” or “missing product information,” showing you exactly where to focus training or process improvements.
Build a Knowledge Base: Create a centralized, easily searchable resource with standard operating procedures and solutions for common issues. This gives every team member, from a new retail associate to a seasoned hotel concierge, the information they need to resolve problems on the spot.
6. Customer Retention Rate
Customer Retention Rate measures the percentage of customers who continue doing business with you over a specific period. This metric reflects overall customer loyalty and satisfaction, showing whether your service improvements are preventing churn. For hospitality, restaurants, retail, and healthcare providers, retention rate directly impacts lifetime value and is often more cost-effective than acquiring new customers, making it one of the most important key performance metrics for customer service.
How to Calculate and Use Customer Retention Rate
The calculation for Customer Retention Rate is direct and revealing. It compares the number of customers you've kept over a period against the number you started with, excluding new customers acquired during that time.
Formula:
((Number of Customers at End of Period - Number of New Customers Acquired) / Number of Customers at Start of Period) x 100 = % Retention Rate
A high retention rate is a clear sign that your service, product, and overall experience are building loyalty. A declining rate signals that customers are leaving, and it’s critical to understand why. Tracking this metric helps you quantify the long-term financial impact of your customer service efforts.
Putting Customer Retention Rate into Action
Improving retention requires a proactive strategy that connects satisfaction to loyalty. Here’s how to turn retention data into a powerful growth engine:
Segment Your Analysis: Don't just track one overall rate. Segment retention by customer cohort, acquisition channel, or service used. For example, a hotel could track the repeat booking rate for guests who came from a specific marketing campaign.
Correlate with Feedback: Link your retention data directly to satisfaction scores. Identify the specific satisfaction levels that correlate with high retention and those that signal a churn risk. This helps you know what "good" really looks like.
Implement Win-Back Campaigns: Target recently churned customers with specific offers or communications. Understanding the reasons they left, often found in exit surveys, allows you to address the issue and invite them back.
Identify At-Risk Customers: Don’t wait for customers to leave. FeedbackRobot's Radar gives you unified review intelligence, a view of all customer feedback that allows you to spot negative trends and low satisfaction scores tied to specific customers. This early warning system helps you intervene before they churn, protecting your revenue.
7. Average Resolution Time (ART)
Average Resolution Time (ART) measures the total duration from when a customer first reports an issue until it is fully resolved. While First Response Time (FRT) focuses on the initial reply, ART covers the entire journey, making it a critical metric for understanding overall service efficiency and the customer's waiting experience. For service-dependent businesses, a high ART often leads to customer frustration, increased support costs, and a higher risk of negative reviews. Tracking this is one of the most important key performance metrics for customer service you can monitor.
How to Calculate and Use ART
To calculate ART, you sum the total time taken to resolve all tickets within a specific period and divide it by the number of tickets resolved in that same period. The time is usually measured in business hours to provide a more accurate picture of your team's active effort.
Formula:
Total Resolution Time for All Tickets / Total Number of Resolved Tickets = Average Resolution Time
While ART focuses on the total time to solve a customer issue, it's also crucial to consider the related metric of Mastering Average Handle Time (AHT) for individual interactions, which contributes significantly to operational efficiency. A consistently low ART indicates your team can solve problems quickly, directly impacting customer satisfaction and loyalty.
Putting ART into Action
Lowering your ART without sacrificing quality is a powerful way to improve the customer experience. Here’s how to make this metric work for your business:
Set Tiered Targets: Not all issues are equal. A restaurant might aim to resolve a food quality complaint in under two hours, while a hotel might set a 24-hour target for a complex billing dispute. Differentiate your ART goals based on issue severity.
Identify Bottlenecks: Track ART by issue type (e.g., "room maintenance," "return request," "billing error"). If one category consistently has a high ART, it signals a systemic problem like a knowledge gap or a process inefficiency that needs to be addressed.
Minimize Handoffs: Every time an issue is transferred to another person or department, the resolution clock keeps ticking and the risk of a poor experience increases. Empower your frontline staff with the tools and authority to resolve more issues on their own.
Automate Resolution Workflows: Manually tracking, assigning, and following up on every customer issue is slow and prone to error. FeedbackRobot’s Resolutions Engine provides automated service recovery. It can auto-assign tasks based on issue type, set deadlines, and send reminders, ensuring no problem falls through the cracks and your ART is consistently optimized.
8. Customer Sentiment Analysis & Satisfaction Trend
Customer Sentiment Analysis moves beyond simple scores to uncover the why behind customer feedback. Using AI and natural language processing, this metric automatically analyzes text from reviews, surveys, and social media to determine the emotional tone-positive, negative, or neutral. It gives you a direct line into your customers' unfiltered perceptions, revealing nuanced issues and satisfaction drivers that numerical scores like CSAT or NPS can't capture on their own. For any service business, from hotels to healthcare, tracking sentiment trends is crucial for spotting emerging problems before they escalate.
How to Calculate and Use Sentiment Analysis
Sentiment analysis isn't calculated with a simple formula like other metrics; it’s an automated process performed by sophisticated AI models. These models are trained on vast datasets to recognize the emotional intent behind words and phrases. The output is typically a score (e.g., -1 for negative, +1 for positive) and a categorization of the text.
Process: AI analyzes unstructured text (reviews, comments) -> Assigns a sentiment score (Positive, Negative, Neutral) -> Identifies key themes and topics driving that sentiment.
Understanding what drives your sentiment is a critical part of tracking key performance metrics for customer service. To learn more about the specifics of this powerful technique, you can explore this complete guide on what is customer sentiment analysis and how to apply it to your business.
Putting Sentiment Analysis into Action
Actively monitoring sentiment transforms qualitative feedback from a noisy dataset into a clear action plan. Here’s how you can make it a central part of your operations:
Automate Everything: Manually reading every comment is unsustainable. FeedbackRobot’s AI Summaries feature performs instant insights & sentiment analysis on all incoming feedback, categorizing comments as positive or negative and identifying recurring themes like “long wait times” or “friendly staff.” This lets you see what's driving customer emotion at a glance.
Track Trends Over Time: Review sentiment trends weekly within your FeedbackRobot dashboard. A sudden dip in positive sentiment can be an early warning of a service gap or operational issue that needs immediate attention.
Segment for Clarity: Don't stop at the overall score. Filter sentiment by location, service type, or even specific team members to pinpoint exactly where you are excelling and where training is needed.
Combine with Quantitative Scores: Pair your sentiment insights with metrics like CSAT or NPS. A low CSAT score combined with negative sentiment around “cleanliness” gives you a precise problem to solve, enabling a fast and effective response.
9. Response/Review Rate and Engagement
Response Rate measures the percentage of customers who complete a survey or provide feedback when requested. This metric is foundational; without a sufficient volume of responses, other key performance metrics for customer service become statistically unreliable. Low engagement can signal that customers feel their voice doesn't matter or that your feedback process is too cumbersome. Conversely, high engagement suggests customers trust you to listen and act on their input, making it a powerful indicator of a healthy customer relationship.
How to Calculate and Use Response Rate
Calculating this metric is simple. You divide the number of people who responded to your feedback request by the total number of people who received the request, then multiply by 100 to get a percentage. Healthy rates vary by industry; hotels often see 30-40% on post-stay surveys, while restaurants using QR codes may get 15-20% immediate feedback.
Formula:
(Number of Responses / Total Number of Surveys Sent) x 100 = % Response Rate
A low response rate is a problem that needs fixing before you can trust your CSAT or NPS data. Improving it means making feedback easier and more rewarding for the customer. A strong rate ensures your data accurately reflects your entire customer base, not just the most vocal individuals.
Putting Response Rate into Action
Boosting engagement is the first step to unlocking meaningful insights. Here’s how to get more customers to share their experiences:
Make It Effortless: Deploy feedback requests immediately after an interaction via the most convenient channel, whether it's SMS, email, or a QR code at the point of service.
Keep It Brief: Maximize completion rates by sticking to 1-3 essential questions. A long survey is a dead-end for busy customers.
Automate and Optimize: Use FeedbackRobot’s Prompt to Survey to automatically send optimized feedback requests to guests or customers after their transaction. Our templates are designed for high engagement, taking the guesswork out of crafting effective invitations.
Show You're Listening: Share aggregated feedback results and the changes you’ve made with your customers. Demonstrating that their voice leads to action is the single best way to encourage future participation.
10. Average Response Quality Score and Tone Analysis
While speed and resolution are important, the quality of a customer service response determines whether you strengthen or damage the customer relationship. The Average Response Quality Score and Tone Analysis is a metric that evaluates the helpfulness, professionalism, empathy, and brand alignment of your team's communications. Moving beyond simple resolution rates, this qualitative assessment ensures every interaction reflects your brand's values and genuinely addresses the customer's needs, which is one of the most crucial key performance metrics for customer service. For industries like healthcare, where a compassionate tone is non-negotiable, or professional services, where clarity and expertise are paramount, this metric is a direct reflection of service excellence.
How to Calculate and Use Response Quality Scores
Calculating a quality score involves creating a rubric and auditing a sample of responses against it. Reviewers grade each interaction on defined criteria (e.g., on a 1-5 scale), and the scores are averaged to find the team's overall quality score.
Formula:
(Sum of All Quality Scores) / (Total Number of Responses Reviewed) = Average Quality Score
A low score indicates a systemic issue in training or process, while a high score confirms your team is not just closing tickets but building customer loyalty. Tracking response quality helps ensure that even templated or automated replies maintain a human, empathetic touch that resonates with customers.
Putting Response Quality into Action
Consistently delivering high-quality, on-brand responses is a direct driver of customer satisfaction and retention. Here's how to make it a core part of your operations:
Establish a Clear Rubric: Create a scorecard with 5-7 key criteria that matter to your brand. This could include empathy, clarity, completeness, personalization, and brand voice.
Audit Consistently: Commit to auditing a meaningful percentage of responses (e.g., 10-20%) across all channels each month. This provides a reliable sample size for accurate insights.
Correlate with CSAT: Compare your quality scores against CSAT and CES data. This helps you prove that higher-quality responses lead directly to happier, more loyal customers.
Automate Tone and Sentiment Analysis: Manually checking every response for empathy is impossible. FeedbackRobot's AI Summaries provide instant insights & sentiment analysis of your team's responses, giving you a clear, at-a-glance view of whether your communications are empathetic, professional, and aligned with your brand values without manual review.
Top 10 Customer Service Metrics Comparison
Metric | Implementation complexity | Resource requirements | Expected outcomes | Ideal use cases | Key advantages | Primary limitations |
|---|---|---|---|---|---|---|
Customer Satisfaction Score (CSAT) | Low — 1–2 question post-interaction surveys | Minimal — survey tool, distribution at touchpoints | Immediate satisfaction snapshot for specific interactions | Hospitality, restaurants, retail, transactional moments | Highly actionable, quick to administer and benchmark | Lacks depth, recency and response bias, not a loyalty measure |
Net Promoter Score (NPS) | Low–Medium — periodic surveys with follow-ups and segmentation | Survey platform, periodic sampling, benchmarking data, follow-up workflows | Loyalty indicator and growth predictor; promoter/detractor segmentation | Brand loyalty tracking across industries, long-term performance | Widely recognized, correlates with revenue, executive-friendly | Single-question context limited, cultural bias, slower to change |
Customer Effort Score (CES) | Low — single-question at key moments | Minimal — integration at transaction points, basic analysis | Measures ease of interaction and identifies friction points | Support interactions, onboarding, returns, booking flows | Strong predictor of loyalty, actionable for process improvements | Low effort ≠ satisfaction, risk of oversimplification, needs operational follow-up |
First Response Time (FRT) / Response Time | Low–Medium — timestamp tracking across channels | Monitoring tools, staffing/SLA alignment, channel monitoring | Measures responsiveness and sets customer expectations | Time-sensitive channels (chat, social, reviews, complaints) | Improves perceived service, measurable SLAs and benchmarks | Speed ≠ quality, can encourage rushed or shallow replies |
First Contact Resolution (FCR) | Medium — must track resolution status and follow-up outcomes | Knowledge base, training, tracking systems, customer confirmation | Higher immediate resolution rates, lower repeat contacts and costs | Contact centers, in-person service, billing and operational issues | Strong correlation with satisfaction, reduces churn and costs | Hard to measure accurately, complex issues may need multiple touches |
Customer Retention Rate | Medium — cohort and longitudinal analysis | CRM/data tracking, cohort segmentation, long-term reporting | Indicator of loyalty, revenue stability, and LTV improvements | Subscription models, repeat-visit businesses, professional services | Direct business-health metric; cost-effective growth focus | Slow to reflect changes, influenced by external factors, attribution is hard |
Average Resolution Time (ART) | Medium — end-to-end resolution tracking required | Ticketing systems, process mapping, automation tools | Operational efficiency insights; reduced wait and handling time | Support teams, maintenance, refunds, complex issue resolution | Identifies bottlenecks, informs staffing and process changes | Quality vs speed trade-offs, external delays can inflate times |
Customer Sentiment Analysis & Satisfaction Trend | Medium–High — AI/NLP setup, tuning and integration | AI tools, training data, analyst review, privacy controls | Thematic insights, trend detection, early warning of issues | Reviews, open-text surveys, social media monitoring | Scales qualitative analysis, uncovers nuanced themes and emerging problems | Misinterprets sarcasm/cultural nuance, needs calibration and human review |
Response / Review Rate and Engagement | Low–Medium — tracking and optimization of channels | Multichannel distribution, testing, possible incentives | Improves sample representativeness and reliability of insights | Any feedback program where valid samples are needed | Foundation for reliable metrics; reveals best channels and timing | Response bias, survey fatigue, variable segment engagement |
Average Response Quality Score & Tone Analysis | Medium–High — quality rubric + audits or AI scoring | QA team, training, AI scoring tools, regular audits | Higher-quality, empathetic, brand-aligned communications; fewer escalations | Customer support, public responses, regulated communications | Ensures helpful, empathetic responses; identifies training gaps | Subjective scoring, time-consuming, AI requires human verification |
From Data to Action: How to Build Your Feedback Operating System
We have explored a detailed roster of essential customer service metrics, from the foundational Customer Satisfaction Score (CSAT) and Net Promoter Score (NPS) to the operational efficiency of First Response Time (FRT) and Average Resolution Time (ART). Understanding the definitions, formulas, and benchmarks for these key performance metrics for customer service is the critical first step. You now have the blueprint for what to measure. However, measurement alone does not drive growth or improve guest loyalty. The real power comes from translating that raw data into immediate, intelligent action.
The challenge for most busy operators, whether in hospitality, retail, or healthcare, isn't a lack of data; it's a surplus of it scattered across too many platforms. Juggling Google reviews, TripAdvisor comments, internal surveys, and social media mentions creates a fragmented view of the customer experience. This is where moving from isolated metrics to an integrated system becomes a significant competitive advantage.
Operationalize Your Insights with a Feedback Operating System
Instead of drowning in disconnected spreadsheets and dashboards, a Feedback Operating System centralizes your entire feedback loop, turning a reactive process into a proactive growth engine. This system is built to help you collect smarter, act faster, and grow stronger. Here is how it works in practice, using the tools within FeedbackRobot:
Unify Your Intelligence: Stop logging into a dozen different sites. Our Radar feature acts as your central command center, providing unified review intelligence by pulling all your public reviews and social mentions from across the web into a single, unified inbox. This gives you a complete, 360-degree view of your brand reputation in real time, a vital function for businesses managing multiple locations or complex service offerings.
Dig Deeper, Automatically: A low star rating tells you what happened, but not why. When a negative review appears in Radar, our Prompt to Survey feature can automatically trigger a targeted, private survey to that customer. This allows you to gather specific, actionable details behind their score, a crucial capability for hotels using Mews or restaurants on Toast who need to understand service gaps quickly.
Find the Signal in the Noise: Manually reading through thousands of reviews is impossible. Our AI Summaries do the heavy lifting for you, providing instant insights & sentiment analysis. It instantly analyzes sentiment, identifies recurring themes, and pinpoints emerging trends. You can see at a glance if "room cleanliness" is a rising issue or if a specific menu item is receiving consistent praise, turning unstructured text into clear, actionable insights.
Automate Service Recovery: A swift, effective response can turn a detractor into a loyal advocate. The Resolutions Engine provides automated service recovery. You can set rules to automatically trigger service recovery actions based on specific feedback. For example, a one-star review mentioning a cold meal could automatically send the customer a personal apology and a digital voucher for their next visit, solving the problem before it escalates.
By connecting these functions, you create a seamless loop. You collect smarter data from all sources, analyze it instantly to find the root cause, and act faster with automated, personalized resolutions. This systematic approach moves you beyond simply tracking key performance metrics for customer service and empowers you to actively manage and improve them, driving tangible results like higher retention, better reviews, and a stronger bottom line.
Ready to turn your customer feedback into your biggest growth engine? The best way to see the power of a Feedback Operating System is to try it yourself. Generate your Hotel Management Guest Experience Survey.
