A Hospitality Owner’s Guide to Customer Retention Metrics That Actually Matter

For any busy hospitality owner, repeat customers are the lifeblood of your business. But are your efforts to build loyalty actually working? Gut feelings won't cut it. The real answer is in your customer retention metrics—the hard numbers that tell the true story of your customer loyalty and business health.
Why Your Repeat Customers Are Your Greatest Asset
Instead of relying on guesswork, these metrics give you a clear, actionable scorecard. They show you exactly how many customers you're keeping, what they're worth, and where you're at risk of losing them. This guide will demystify the essential numbers you need to be tracking, turning abstract data into real-world strategies.
This isn't just about crunching numbers. It's about building a sustainable, thriving business powered by happy, loyal guests. We'll show you how to collect smarter data, act faster on what it tells you, and grow stronger by creating an experience that people want to come back to again and again.
The Financial Power of Loyalty
Focusing on keeping the customers you already have isn’t just a feel-good strategy—it’s one of the most powerful financial moves you can make. Bringing in a new customer is five to seven times more expensive than keeping an existing one. Just think about the marketing budget, promotional offers, and sales effort it takes to win over a complete stranger.
Your current customers, on the other hand, already know and trust you. They’re far more likely to try a new dish, book another stay, or forgive a minor slip-up in service. The financial impact here is huge. Research has shown that a small improvement in retention can have a massive effect on your bottom line. A tiny 5% increase in customer retention can boost profits by 25% to 95%. This proves that loyalty is your most valuable currency. Learn more about the business impact of customer retention.
A Glimpse Into Your Retention Scorecard
To get started, it helps to know which numbers truly matter. Think of these metrics as the vital signs for your business's health—they tell you if your customer base is growing, shrinking, or becoming more valuable over time.
Before we dive deep, here’s a quick summary of the key metrics we'll cover. This table gives you an at-a-glance look at what each metric measures and why it’s so critical for your hospitality business.
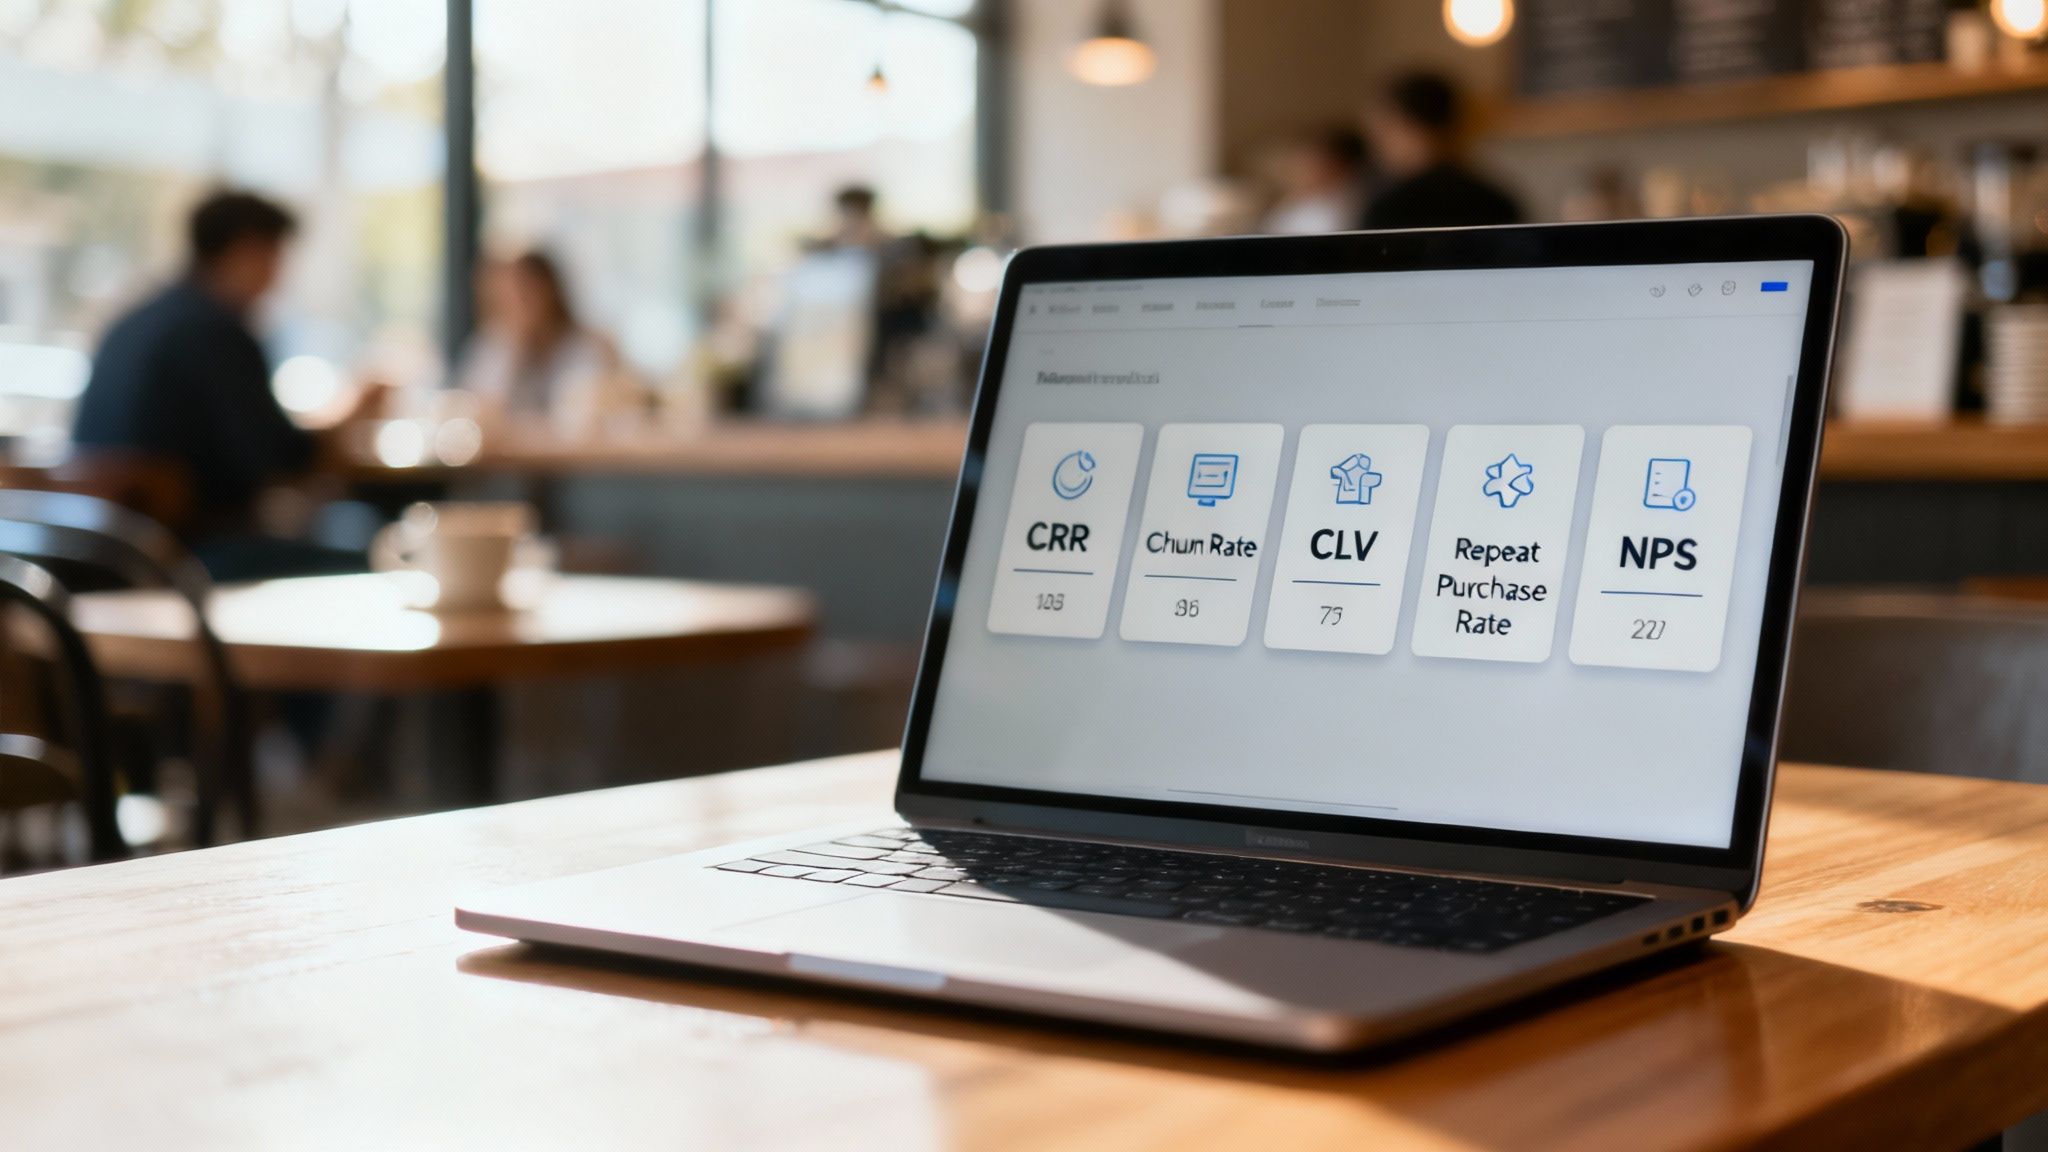
Key Customer Retention Metrics at a Glance
Metric Name | What It Measures | Why It Matters for Your Business |
|---|---|---|
Customer Retention Rate | The percentage of customers who stick with you over a set period. | Shows the overall stability and loyalty of your customer base. |
Churn Rate | The percentage of customers you lose over that same period. | Pinpoints how quickly customers are leaving, acting as an early warning system. |
Customer Lifetime Value | The total revenue you can expect from a single customer over their entire relationship with you. | Helps you identify your most valuable guests and diners. |
Repeat Purchase Rate | The proportion of customers who have made more than one purchase. | Measures immediate loyalty and the effectiveness of your customer experience. |
Net Promoter Score | Customer willingness to recommend your business to friends and family. | Gauges overall satisfaction and your potential for word-of-mouth growth. |
Getting a handle on these figures is the first step. It’s how you transform your business from one that simply serves customers to one that builds lasting, profitable relationships that stand the test of time.
The Essential Metrics Every Hospitality Business Must Track
To really get a grip on customer loyalty, you have to learn the language of data. Gut feelings about guest happiness are a decent start, but they won't show you the full picture or reveal where your business is quietly leaking revenue. The key is to zero in on a handful of powerful customer retention metrics that act like your business's vital signs.
These numbers aren't just for spreadsheets; they're direct indicators of your operational health. Let's break down the five most critical metrics for any service business, turning abstract concepts into practical tools you can start using today.
Customer Retention Rate (CRR)
Think of your Customer Retention Rate as your loyalty scorecard. It’s the percentage of customers who stick with you over a set period. A high CRR means your guests love what you're doing and have no reason to look elsewhere. It's the purest measure of how well you're building real relationships.
Formula:
[(Customers at End of Period - New Customers Acquired) / Customers at Start of Period] x 100Hotel Example: Your hotel started the quarter with 500 loyalty members. You signed up 100 new members, and by the end of the quarter, you had 550 total. Your CRR would be
[(550 - 100) / 500] x 100 = 90%. That tells you 90% of your original loyalty members stayed put.
Customer Churn Rate
Churn Rate is the flip side of retention—it's the speed at which you're losing customers. While it can be a tough number to face, it’s one of your most valuable diagnostics. It acts as an early warning system, flagging problems before they spiral out of control. A sudden jump in churn is a red alert telling you to act fast.
Formula:
(Lost Customers / Total Customers at Start of Period) x 100Restaurant Example: Your restaurant had 1,000 regulars in your reservation system at the beginning of the year. By the end, 150 of them hadn't booked in over six months, so you consider them lost. Your churn rate is
(150 / 1,000) x 100 = 15%.
Understanding your churn rate is the first step to fixing it. It's not just a number—it's a direct reflection of your customer experience. A high churn rate signals that something in your service, product, or overall experience is falling short of expectations.
Customer Lifetime Value (CLV)
Customer Lifetime Value forecasts the total revenue you can expect from a single customer over their entire relationship with your business. This metric is a game-changer because it helps you spot your most valuable guests—the ones who are worth investing extra effort to keep happy. Knowing your CLV helps you make smarter calls on everything from marketing spend to loyalty perks.
Formula:
Average Purchase Value x Average Purchase Frequency x Average Customer LifespanHotel Example: A business traveler stays at your hotel 4 times a year (frequency), spending an average of $500 per stay (value). You expect them to remain a customer for 5 years (lifespan). Their CLV is
$500 x 4 x 5 = $10,000.
Repeat Purchase Rate (RPR)
This metric tracks the percentage of your customers who have come back for more. It's a fantastic, real-time indicator of customer satisfaction. While CLV looks at the long game, Repeat Purchase Rate tells you if a first-time guest was impressed enough for a second visit—a make-or-break moment for building long-term loyalty.
Formula:
(Number of Customers with More Than One Purchase / Total Number of Customers) x 100Restaurant Example: In one month, 800 unique customers dined at your restaurant. Out of that group, 200 came back for at least a second meal. Your RPR is
(200 / 800) x 100 = 25%.
Net Promoter Score (NPS)
Finally, Net Promoter Score measures guest satisfaction and loyalty with one simple question: "On a scale of 0-10, how likely are you to recommend our business to a friend or colleague?" It's a powerful predictor of future growth because it gauges your word-of-mouth potential. NPS helps you understand guest sentiment and quickly identify your biggest fans (Promoters) and your most at-risk customers (Detractors).
Formula:
% of Promoters (score 9-10) - % of Detractors (score 0-6)Hotel Example: You survey 100 guests. 60 are Promoters, 30 are Passives (7-8), and 10 are Detractors. Your NPS is
60% - 10% = 50.
Getting a handle on these five metrics is the foundation for any data-driven retention strategy. They give you the "what," helping you see your business with newfound clarity. The next step is to uncover the "why" behind the numbers.
Turning Raw Feedback Into Actionable Insights
Knowing your retention metrics is a great first step, but the numbers alone don't explain the why. A 15% churn rate is an alarm bell, sure, but what’s actually causing the fire? The real answers are buried in the raw, unstructured feedback your customers share every single day across a dozen different places.
To truly collect smarter, you need a way to turn this flood of opinions, complaints, and suggestions into clear, actionable insights.
This is where most busy owners get bogged down. Manually sifting through reviews on Google and TripAdvisor, while also trying to make sense of survey responses and internal feedback forms, is a recipe for burnout. It’s slow, full of errors, and makes it nearly impossible to see the big picture.
You have to connect the dots between a metric like churn and the real-world experiences driving it. That means pulling all that scattered data into one single source of truth.
Unifying Your Feedback Under One Roof
Imagine trying to gauge your business’s health by flipping through a messy stack of disconnected reports. You’d waste hours just piecing together clues instead of actually solving problems. The same thing happens with customer feedback when it's scattered everywhere.
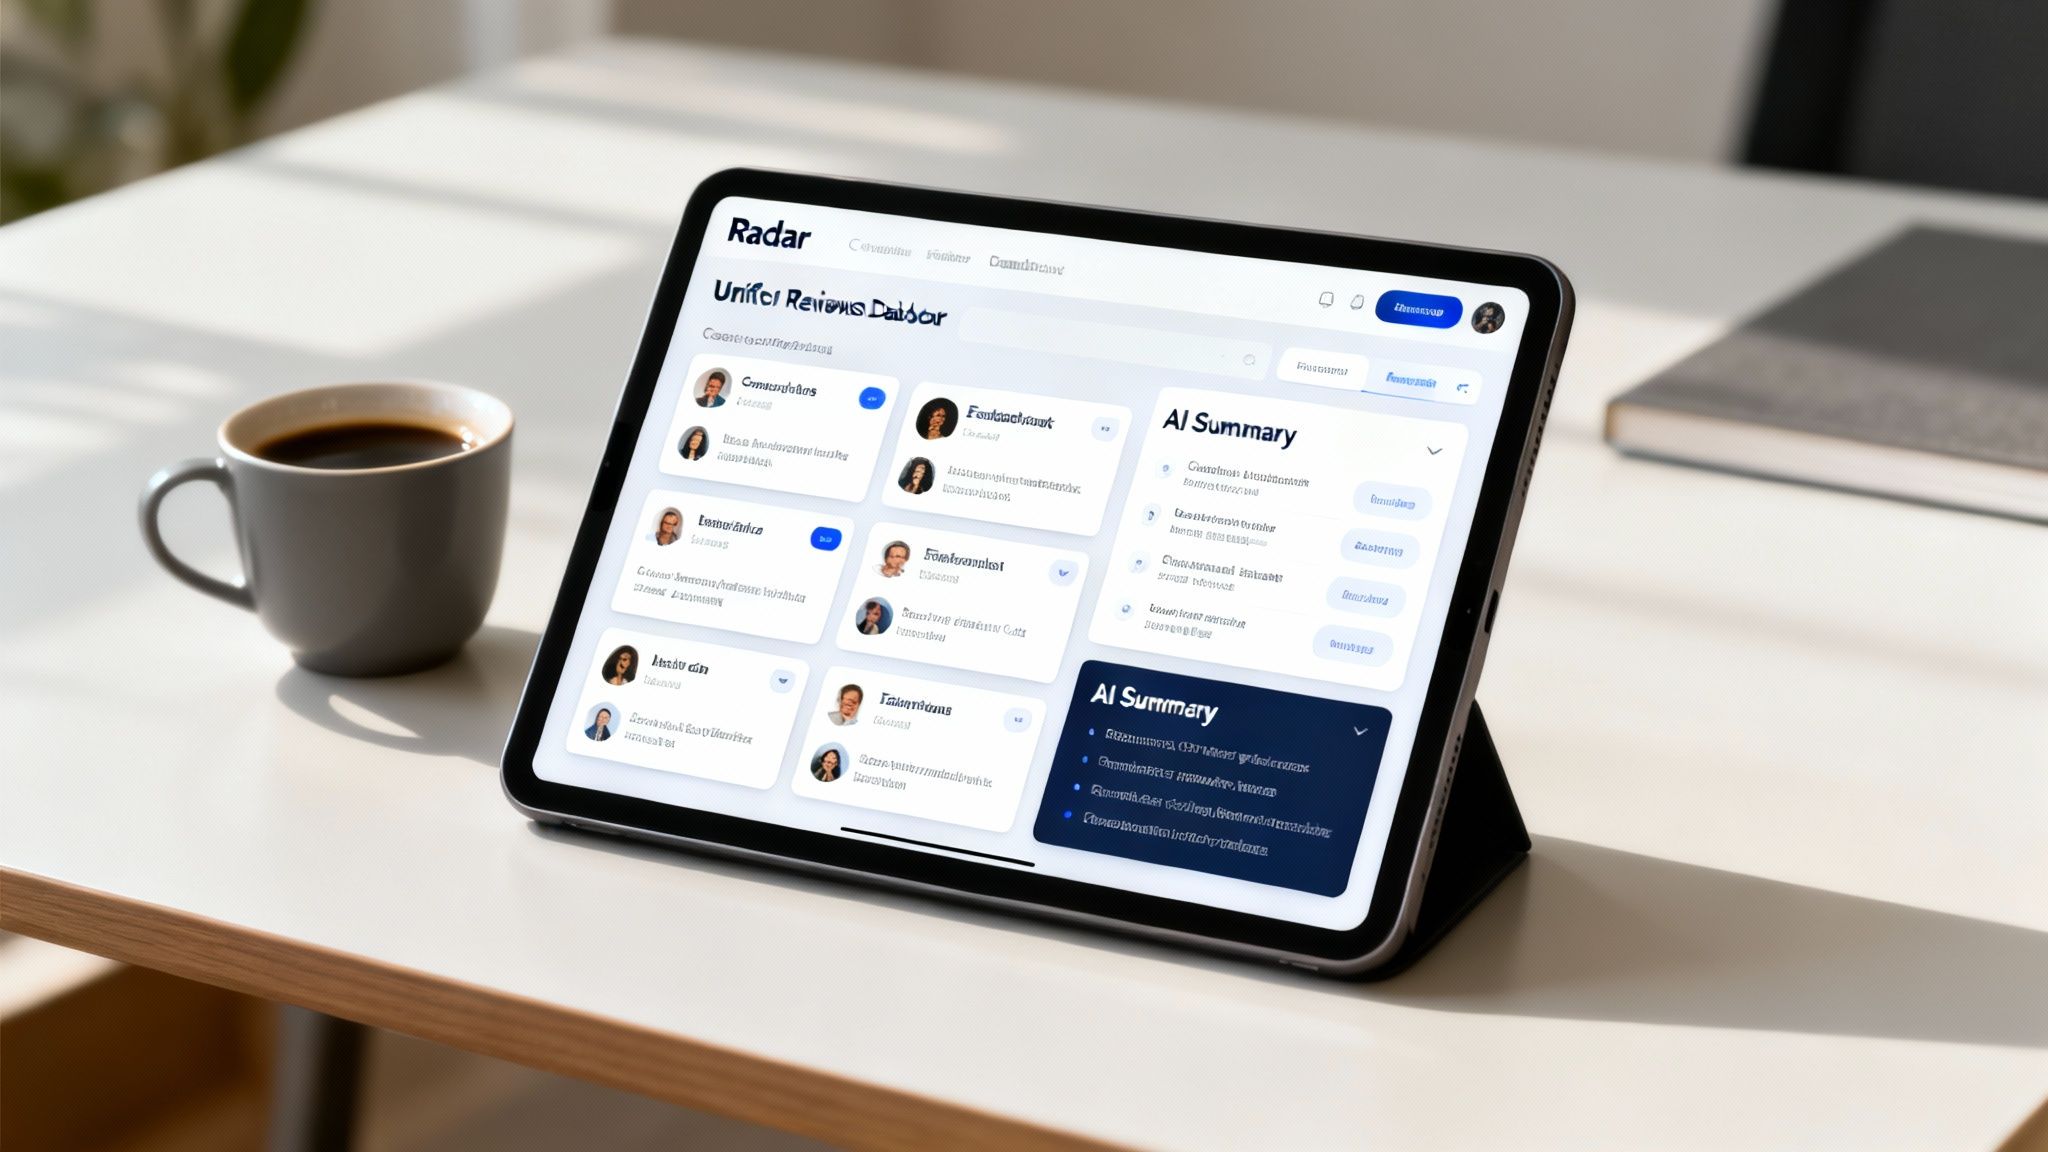
This is exactly why your Feedback Operating System needs Radar.
Radar acts as your unified review intelligence hub, automatically pulling feedback from dozens of sources into one clean dashboard. It consolidates everything from public review sites to direct integrations with your PMS like Mews or your POS like Toast. No more manual copy-pasting, and no more missed opportunities.
By bringing it all together, you finally get a complete, 360-degree view of the customer experience. This is the foundation for turning numbers into strategy and shifting from reactive fire-fighting to proactive improvement.
From Data Overload to Instant Clarity with AI
Once your feedback is in one place, the next challenge is making sense of it all. Reading through hundreds of reviews to spot a pattern just isn't practical for a busy leader. How do you find the common threads that explain a drop in your Net Promoter Score or a sudden spike in churn?
This is where you can act faster with the help of artificial intelligence. AI Summaries transform that mountain of qualitative data into digestible insights in seconds.
AI Summaries instantly analyze all your feedback to pinpoint recurring themes, track guest sentiment, and highlight what drives customers away or keeps them coming back. It moves you beyond simply knowing your Churn Rate to deeply understanding the "why" behind it.
For instance, an AI Summary might reveal that 25% of your negative reviews last month mentioned "slow check-in," or that positive sentiment is strongly tied to mentions of a specific team member. These are the kinds of specific, actionable insights that let you make targeted operational changes.
Here’s how this powerful combination works in practice:
Step 1: Automatic Collection: Radar pulls in feedback from all your channels, from a negative Google review to an NPS survey response triggered after a meal paid for through Toast.
Step 2: Instant Analysis: AI Summaries immediately process this new data, identifying key topics like "room cleanliness," "menu variety," or "staff friendliness."
Step 3: Sentiment Tracking: The AI assigns a sentiment score (positive, negative, neutral) to each piece of feedback, allowing you to track trends over time.
Step 4: Strategic Action: You get a clear, concise report that says, "Your NPS dropped 5 points last quarter, and the primary driver of negative feedback was the wait time at the front desk."
This automated workflow bridges the critical gap between raw data and smart decisions, empowering you to address the root causes of customer churn and build a stronger, more resilient business.
Understanding the 'Why' Behind Customer Churn
Metrics like churn rate tell you what is happening, but they don't tell you why. That's the part that really matters. Knowing that 10% of your regulars vanished last quarter is a wake-up call, but it's not an action plan. To actually fix churn, you have to diagnose the root cause—to get past the numbers and into the real-world experiences pushing people away for good.
This means you have to get proactive. Waiting for the annual survey or a blistering online review is like waiting for the smoke alarm to go off after the fire has started. The damage is done. The goal is to capture feedback in the moments that count, right after an interaction, before a small frustration snowballs into a reason they never come back. This is how you connect the quantitative dots (your churn rate) with the qualitative story (the reasons behind it).
Digging Deeper with Churn Cohorts
One of the most powerful ways to find patterns in your data is through churn cohort analysis. It sounds complicated, but the idea is simple. Instead of looking at all your customers as one giant, faceless group, you segment them based on shared traits or experiences. This helps you isolate variables and zero in on specific problem areas that would otherwise be completely invisible.
For a hospitality business, you could group customers by:
Acquisition Date: Are customers who signed up for your loyalty program during the slow season more likely to leave?
First Service: Do guests whose first stay was in a specific wing of the hotel fail to return?
Behavioral Patterns: Are diners who only order from a promotional menu less likely to become regulars than those who explore the full menu?
By analyzing the churn rate for each of these smaller groups, you can uncover trends you’d never spot otherwise. Imagine finding that "Guests who stayed on the third floor in Q2 had a 30% higher churn rate than any other group." That insight immediately gives you a concrete problem to investigate—maybe a spotty Wi-Fi signal or an issue with the A/C on that floor—instead of just a vague feeling that "some guests are unhappy."
Capturing In-the-Moment Feedback
Identifying cohorts is a great detective tool, but you still need to hear directly from your customers to confirm your suspicions. And the single best time to get honest feedback is immediately after a service experience, while the details are still fresh in their minds.
This is exactly where your Feedback Operating System’s Prompt to Survey feature becomes indispensable.
Prompt to Survey lets you automatically send a targeted survey via SMS or email right after a key interaction, capturing fresh, in-the-moment feedback. This proactive approach uncovers the small points of friction and moments of dissatisfaction before they escalate into reasons for churn.
Picture this: a guest checks out of your hotel through your Mews PMS. The moment that transaction is complete, Prompt to Survey can trigger a simple, two-question survey to their phone asking about their check-out experience. This gives you an immediate pulse on your operations, helping you catch issues long before they show up in your quarterly churn report.
The qualitative data you gather from these surveys has a direct line to your quantitative metrics. A string of low NPS scores from surveys all mentioning "rude staff" is a clear predictor of a coming spike in your Churn Rate. By acting on this feedback immediately, you fix the problem at its source. This process also involves understanding the nuances of customer sentiment, which you can learn more about in our guide on what is customer sentiment analysis.
This proactive feedback loop is critical because bad experiences have become the primary driver of churn. Poor service interactions will rapidly destroy brand loyalty. In fact, 70% of consumers will abandon a brand after just two bad experiences, while 72% will switch after three or fewer poor service interactions. By capturing feedback early and often, you give yourself the chance to intervene, solve problems, and save relationships before they’re lost forever.
How to Turn Unhappy Customers into Loyal Fans with Automated Service Recovery
Spotting a customer problem is only the first step. The real magic—the thing that saves relationships and protects your retention metrics—is resolving it fast.
When you act quickly, you send a powerful message: "We value your business and respect your time." A negative experience handled exceptionally well can create a more loyal customer than someone who never had an issue at all.
But in the whirlwind of daily operations, it’s far too easy for a complaint to get lost in an overflowing inbox or missed during a shift change. That delay turns a fixable problem into a permanent reason for a customer to leave. This is exactly where manual processes fail and automation becomes your most valuable ally.
You need a system that doesn't depend on someone remembering to follow up. You need a reliable, repeatable process that guarantees every piece of negative feedback gets immediate attention and is tracked until it's resolved.
Your Automated Service Recovery System
This is precisely why your Feedback Operating System includes the Resolutions Engine. Think of it as your automated watchdog, working 24/7 to make sure no customer complaint ever falls through the cracks. It gives your team the power to turn negative situations into positive outcomes with speed and consistency.
The Resolutions Engine detects negative feedback in real-time and automatically kicks off a workflow. The moment a poor review, low survey score, or negative comment lands, the system springs into action. This isn't just about sending an alert; it's about starting the fix instantly.
This automated process ensures every issue is owned, tracked, and resolved—which is the bedrock of lowering your churn rate.
A fast response to a complaint can increase customer retention by up to 50%. Automation makes that speed achievable every single time, turning a potential loss into a saved relationship.
How the Resolutions Engine Works in the Real World
Let’s walk through a scenario to see how this feature protects your bottom line.
Imagine a guest, Sarah, checks out of your hotel. Moments later, a Prompt to Survey message pops up on her phone. She rates her stay a 4 out of 10, mentioning a noisy air conditioner that kept her up all night. Without automation, this critical feedback might sit unread for hours, or even days.
But with the Resolutions Engine, here’s what happens in seconds:
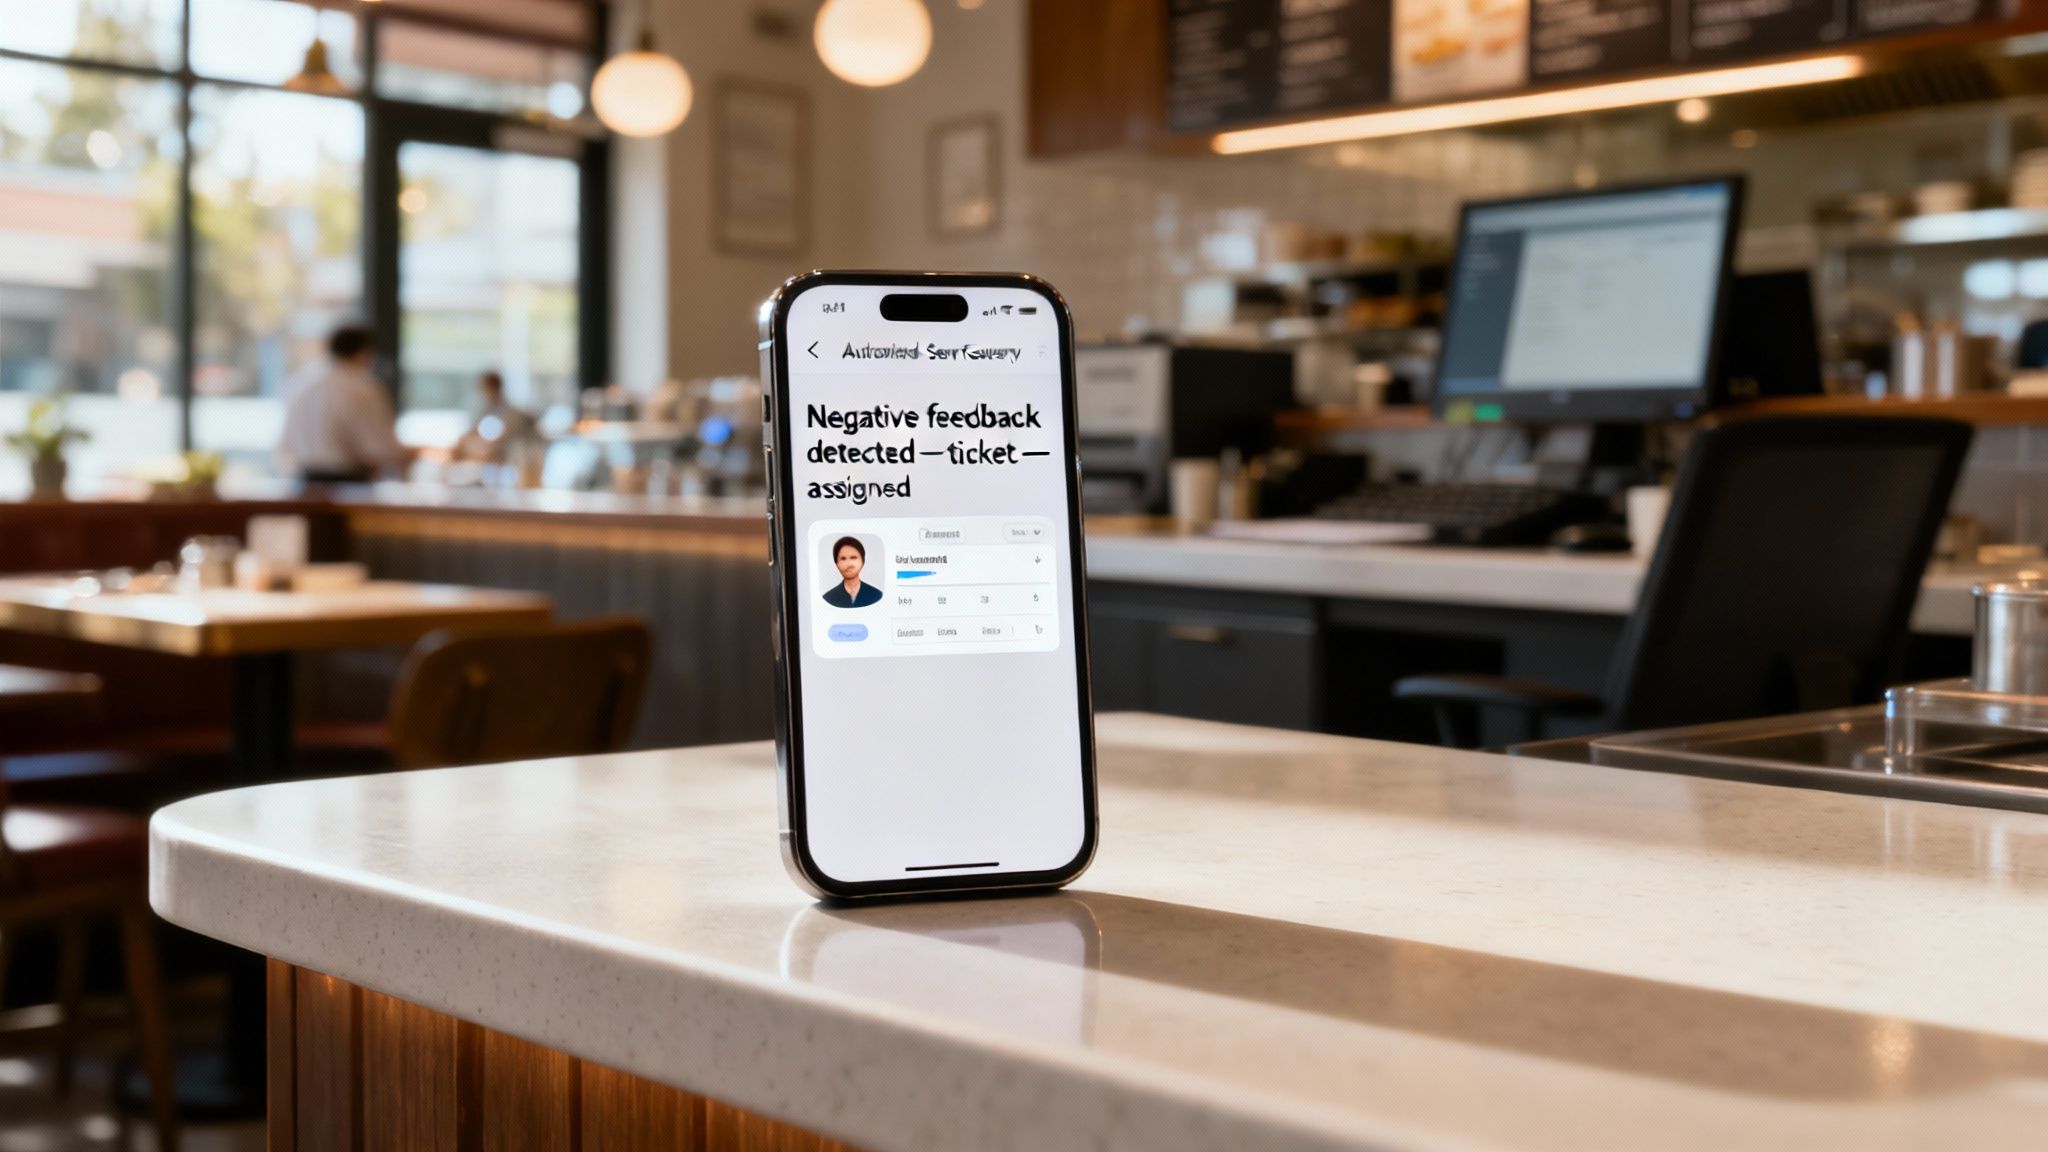
Step 1: Detection: The engine immediately flags Sarah’s low score and the negative keywords ("noisy air conditioner").
Step 2: Assignment: It automatically creates a new ticket and assigns it to the on-duty hotel manager, pinging them with a notification containing all of Sarah’s feedback.
Step 3: Communication: At the same time, the system can send a personalized, pre-approved apology email to Sarah. It acknowledges her issue and lets her know the manager will be in touch shortly.
Step 4: Tracking: The ticket stays open in the manager’s dashboard until they mark it as resolved, creating a clear audit trail and ensuring nothing gets missed.
This entire sequence is over in a flash. The manager has everything they need to solve the problem, and Sarah feels heard and valued, not ignored. That swift, empathetic response is often all it takes to convince an unhappy customer to give you another chance.
Of course, knowing exactly what to say is a skill in itself. You can find proven strategies in our guide on how to respond to customer complaints.
By automating your service recovery, you transform feedback from a passive number into an active retention tool. You stop churn before it happens, strengthen customer relationships with every interaction, and build a reputation for outstanding service that keeps people coming back.
Your Action Plan for Building Stronger Customer Loyalty
Mastering your customer retention metrics isn't just a data exercise—it’s the bedrock of sustainable growth. From tracking core numbers like Customer Retention Rate and Churn to understanding the long-term worth of a customer through their Lifetime Value, each metric tells a piece of your business's story. But the real magic happens when you move from knowing what is happening to understanding why.
This is the journey we’ve mapped out for you: Collect Smarter, Act Faster, and Grow Stronger. It’s all about creating a seamless feedback loop where data fuels decisive action, turning insights into loyalty. The true strength of a platform like FeedbackRobot lies in making this loop effortless and automatic.
From Insight to Action The FeedbackRobot Way
Imagine a system where every piece of feedback—from a scathing online review to a low survey score—is instantly captured and analyzed. That’s the power of having a Feedback Operating System watching your back.
Radar pulls all your reviews into one place, giving you a complete, unbiased view without the manual grunt work.
AI Summaries instantly pinpoint the themes and sentiment behind your metrics, telling you exactly why your NPS is dropping. No more guesswork.
Prompt to Survey captures in-the-moment feedback right after an experience, so you hear from customers before they drift away.
The Resolutions Engine turns this intelligence into immediate action, automating service recovery to fix issues before they cause churn.
This integrated approach connects every dot. It empowers you to stop making assumptions and start making targeted improvements that directly impact your bottom line.
Your Next Step Starts Now
Understanding your metrics is the first step. Improving them is how you win. We want you to experience this power firsthand, completely risk-free. See for yourself how a unified feedback system can transform your operations, save at-risk customers, and drive repeat business.
Ready to turn your customer feedback into your greatest asset? Take control of your customer loyalty today. Start your free 14-day trial of FeedbackRobot—no credit card required—and see how easy it is to collect smarter, act faster, and grow stronger.
Plus, you'll get a first look at our brand-new Spotlight: Feedback Wall. This powerful feature lets you showcase your best reviews directly on your website, turning your happy customers into your most compelling marketing tool. It’s the perfect way to build trust and attract new business.
Frequently Asked Questions
Getting a handle on customer retention can feel like a moving target, but it doesn't have to be confusing. Here are some straightforward answers to the questions we hear most often from hospitality owners.
What Is a Good Customer Retention Rate for a Hotel or Restaurant?
While everyone dreams of 100%, the real-world answer depends on your business model. For hotels and professional services where relationships are longer-term, a rate of 80-85% is a fantastic benchmark to aim for.
Restaurants and e-commerce stores, on the other hand, see more varied visit patterns. In that world, hitting anything above 30% is a sign of a healthy, loyal customer base.
But here’s the most important part: focus on your own trend. If your retention rate is consistently ticking upward month after month, you know your loyalty strategies are hitting the mark.
How Can I Quickly Identify Customers Who Are About to Churn?
The fastest way to spot an at-risk customer is to listen to what they're telling you—both directly and indirectly. This is where combining your metrics with actual feedback becomes so powerful.
Your Feedback Operating System's AI Summaries are your early warning system. They instantly digest the sentiment from all your reviews, so a sudden spike in comments about "long waits" or "cold food" becomes a massive, unmissable red flag.
You can also get proactive with the Resolutions Engine. Imagine a customer gives a low score on a Prompt to Survey response. The system can automatically flag them for immediate follow-up. This gives you a critical window to step in and fix the problem before they decide never to come back.
What Is the Most Important Customer Retention Metric to Track?
If you could only track one metric, make it your Customer Churn Rate. Think of it as the pulse of your business. It's the most direct, unfiltered signal of customer unhappiness.
While metrics like CLV and NPS are crucial for shaping long-term strategy, a rising churn rate is an urgent alarm bell. It tells you that something in your core experience is broken right now.
Once you get a handle on churn and see it stabilizing or decreasing, then you can confidently broaden your focus to the other KPIs to build a more sophisticated and durable loyalty program.